Cost Per Click Is Base CPC Divided by Retention at the CTA
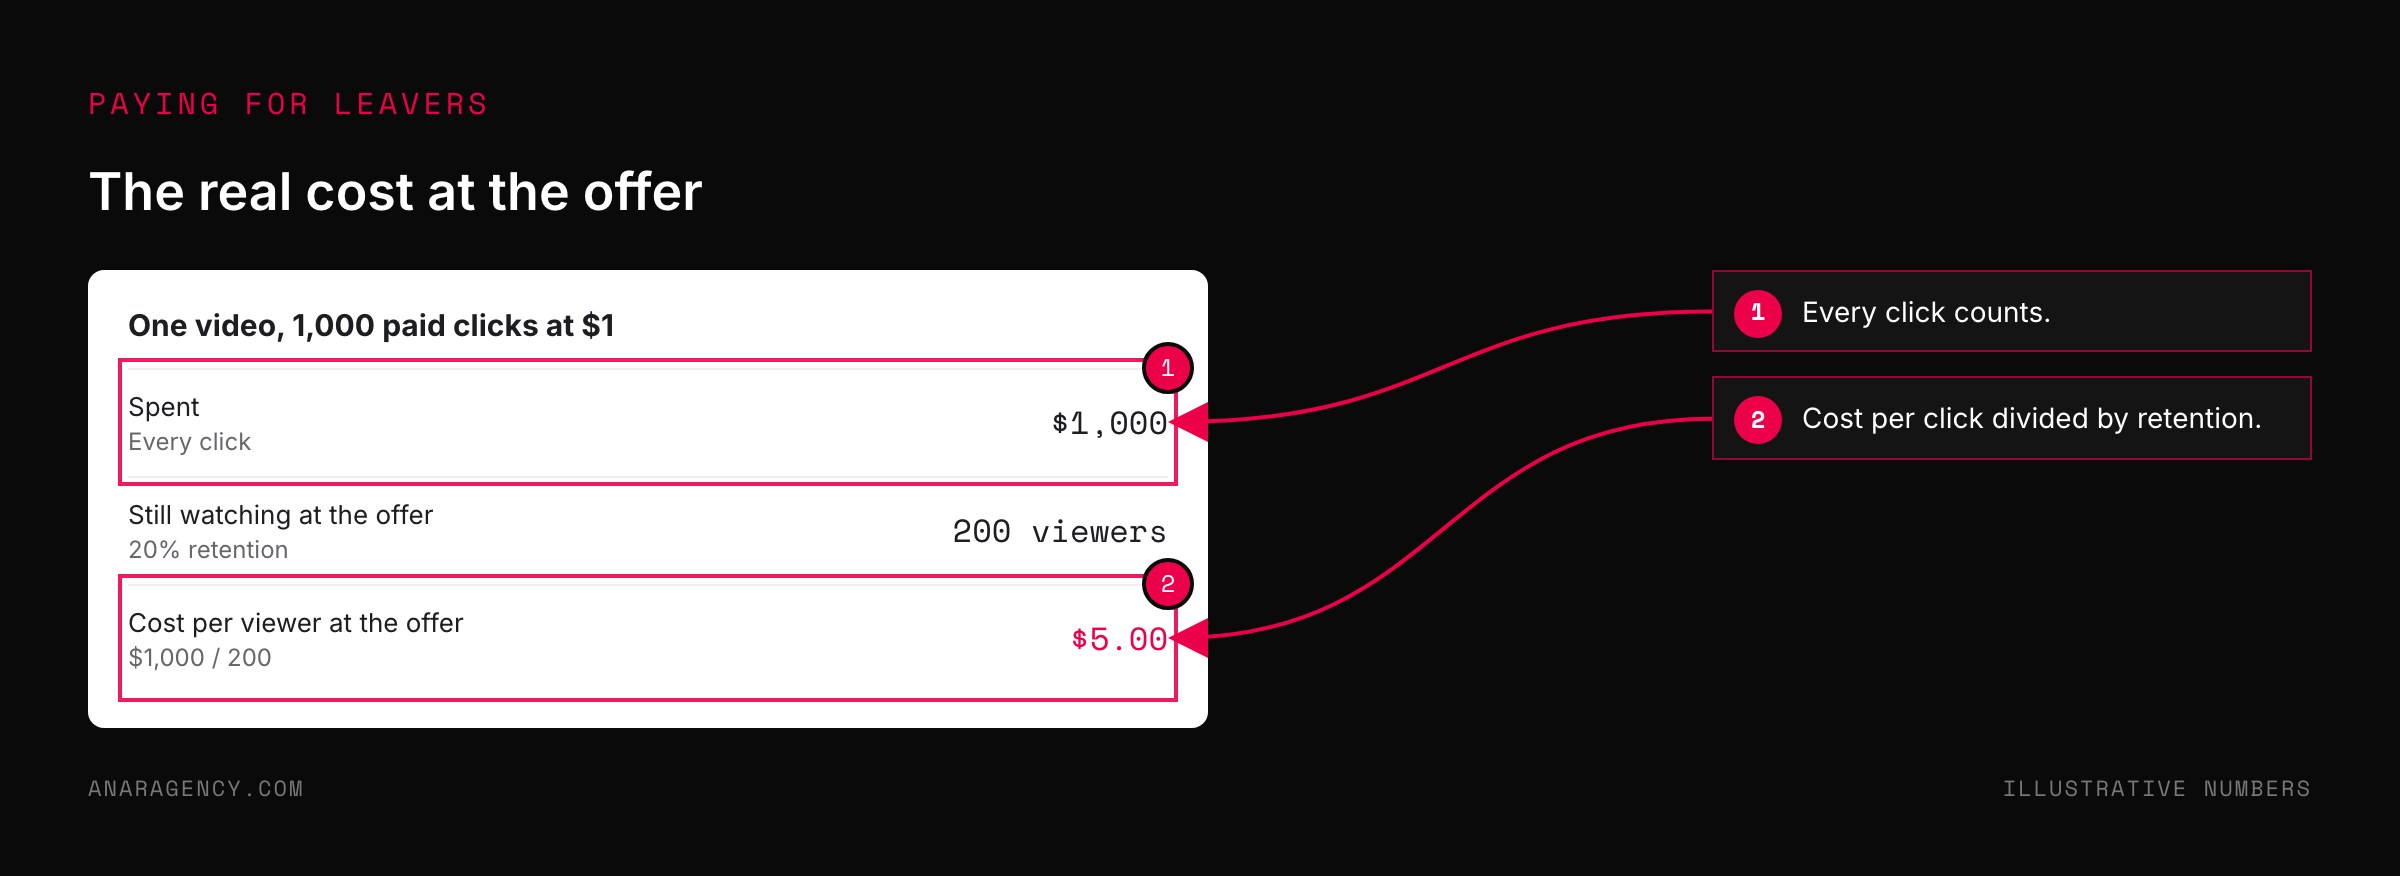
Every click on a sales video ad costs the same, but only viewers still watching when the offer appears can act on it. So the real cost of each viewer who reaches the offer is your cost per click divided by retention at that moment. At $1 per click, 50 percent retention makes it $2, and 20 percent makes it $5.
Longer videos can raise buying intent among those who stay, but they shrink the number who stay. Read your retention graph, find where viewers leave, and move the offer earlier, cut the slow parts, add an early button, or retarget the leavers.
Paying for viewers who leave
When you run a sales video, you pay for every click that starts it. Many of those viewers leave before the offer appears.
You still paid for them. Only the viewers still watching when the offer appears can act on it.
So the useful number is not your cost per click. It is the cost of each viewer who actually reaches the offer.
That number is easy to work out, and it changes how you think about video length.
Divide one by the other.
The formula
Cost per viewer at the offer = cost per click divided by the share of viewers still watching at the offer.
If a click costs $1 and 50 percent of viewers are still watching when the offer appears, each viewer at the offer cost $2.
At 30 percent retention it is $3.33. At 20 percent it is $5.
Nothing about the ad changed. The cost per click is the same; only the position of the offer in the video changed.
That is why a long video can quietly become expensive. Each minute before the offer is a minute in which some of the viewers you paid for leave.
Here is a fuller worked example. A firm spends $2,000 on video ads at $1 per click, so 2,000 people start the video.
The offer appears at minute 18, and 25 percent are still watching. That is 500 viewers at the offer, at $4 each.
If 4 percent of those 500 buy, that is 20 sales, or $100 of ad spend per sale.
Now move the offer to minute 9, where 45 percent are still watching. Even if fewer of them buy, say 3 percent of 900 viewers, that is 27 sales at about $74 each.
These numbers are illustrative. The point is that position alone can change the cost per sale, and you can test it.
Cost per viewer at the offer equals cost per click divided by the share of viewers still watching when the offer appears. At $1 a click, 50 percent retention costs $2 per viewer at the offer and 20 percent costs $5. Length raises intent among those who stay but shrinks how many stay, so find the balance by measuring.
Read the retention graph, then move the offer earlier, cut the steepest drop, add an early button, or retarget the leavers, one change at a time.
Intent and attention move in opposite directions
There is a reason long sales videos exist. The viewers who stay longer tend to be more interested and more likely to buy.
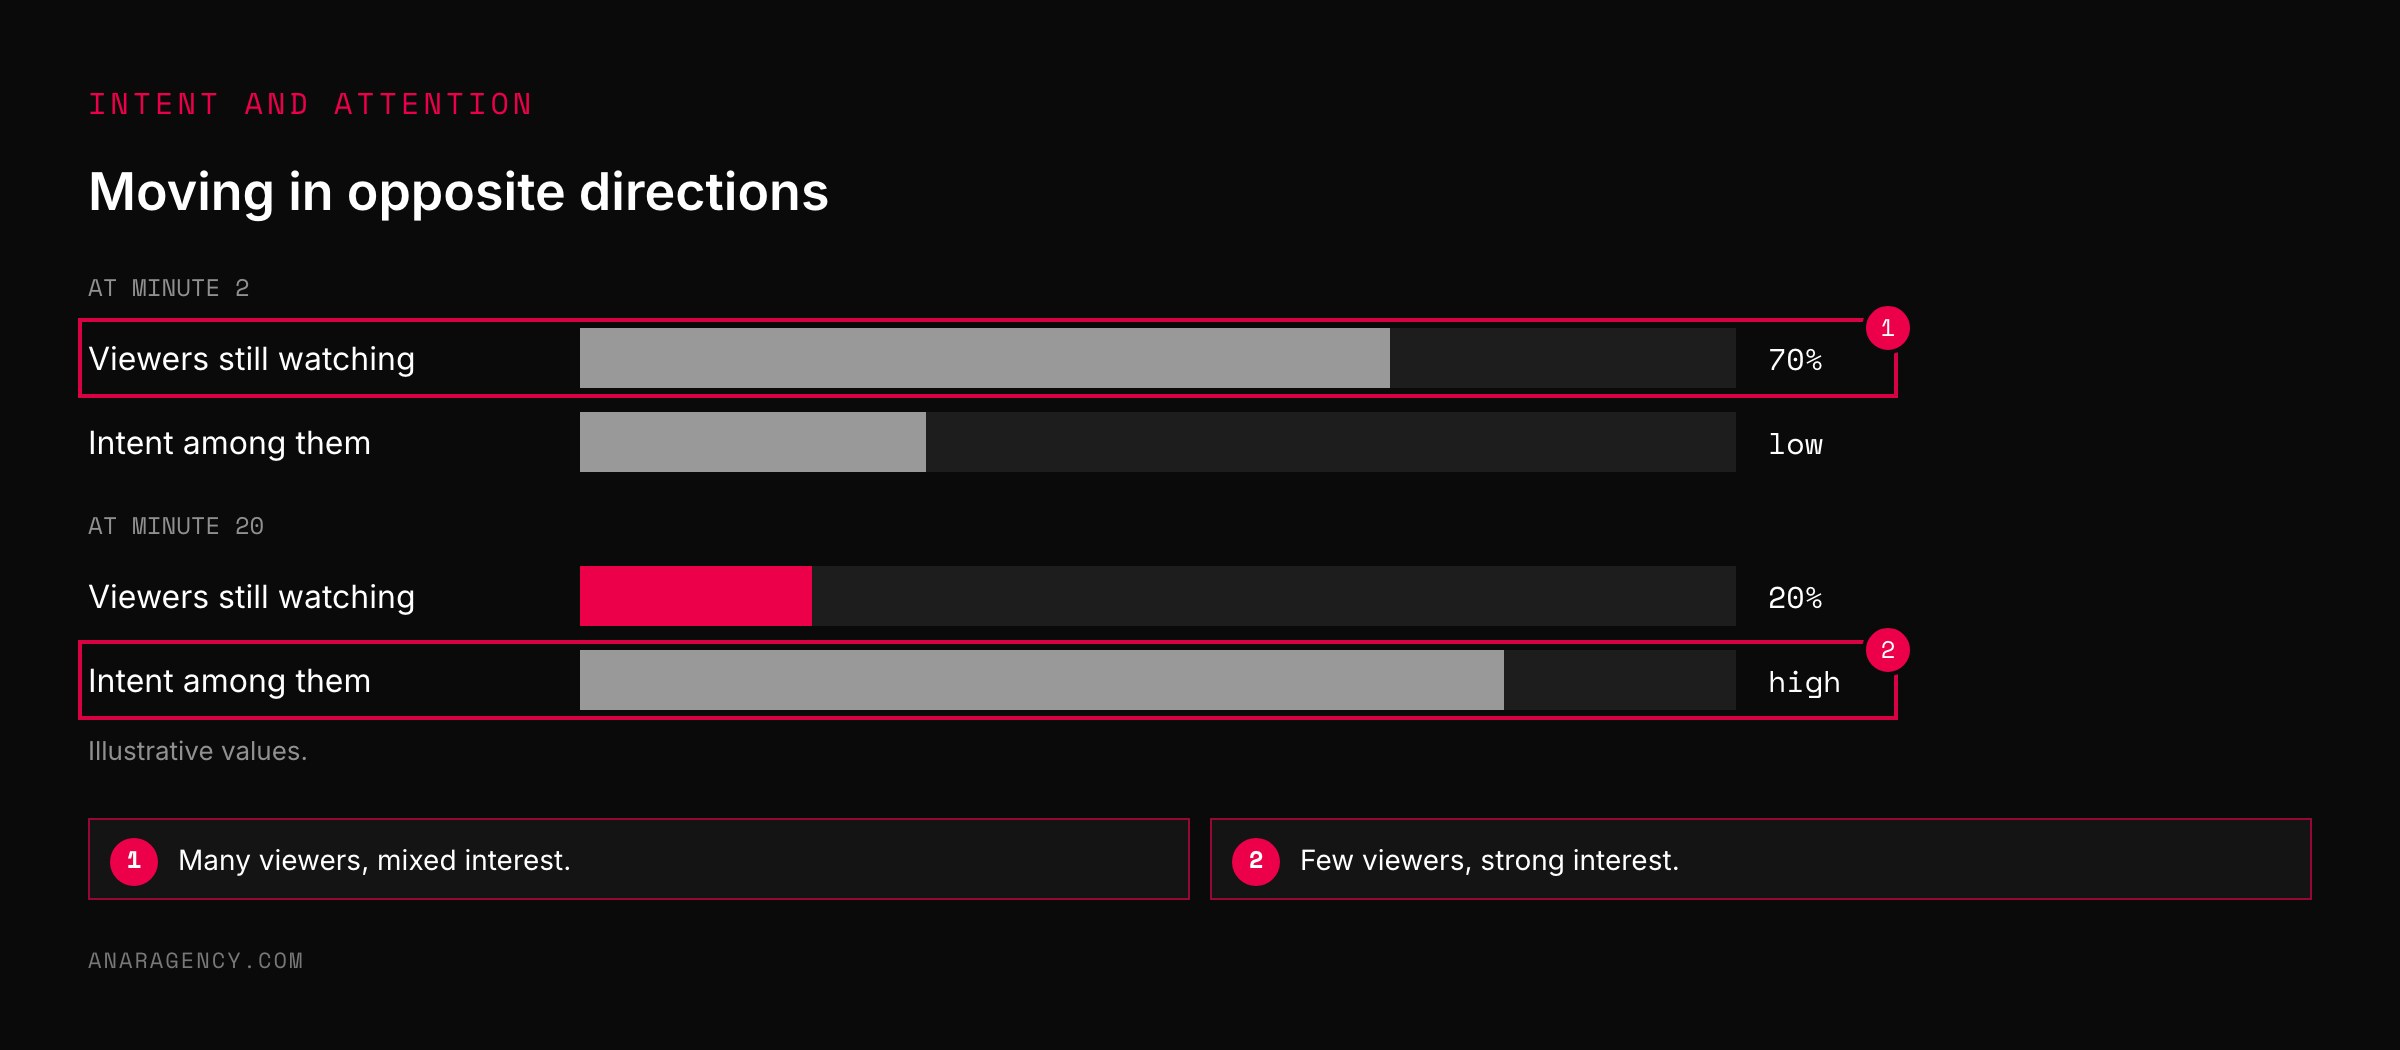
So length has two effects at once. It raises the buying intent of those who remain, and it lowers the number who remain.
The job is to find the point where those two balance: where enough viewers are still there, and interested enough, for the cost per buyer to work.
There is no universal right length. A $50 product and a $5,000 program need different amounts of explanation, and so different balance points.
But you can only find yours by measuring. For what to put in the opening, see the first 90 seconds of a VSL.
Read the retention graph
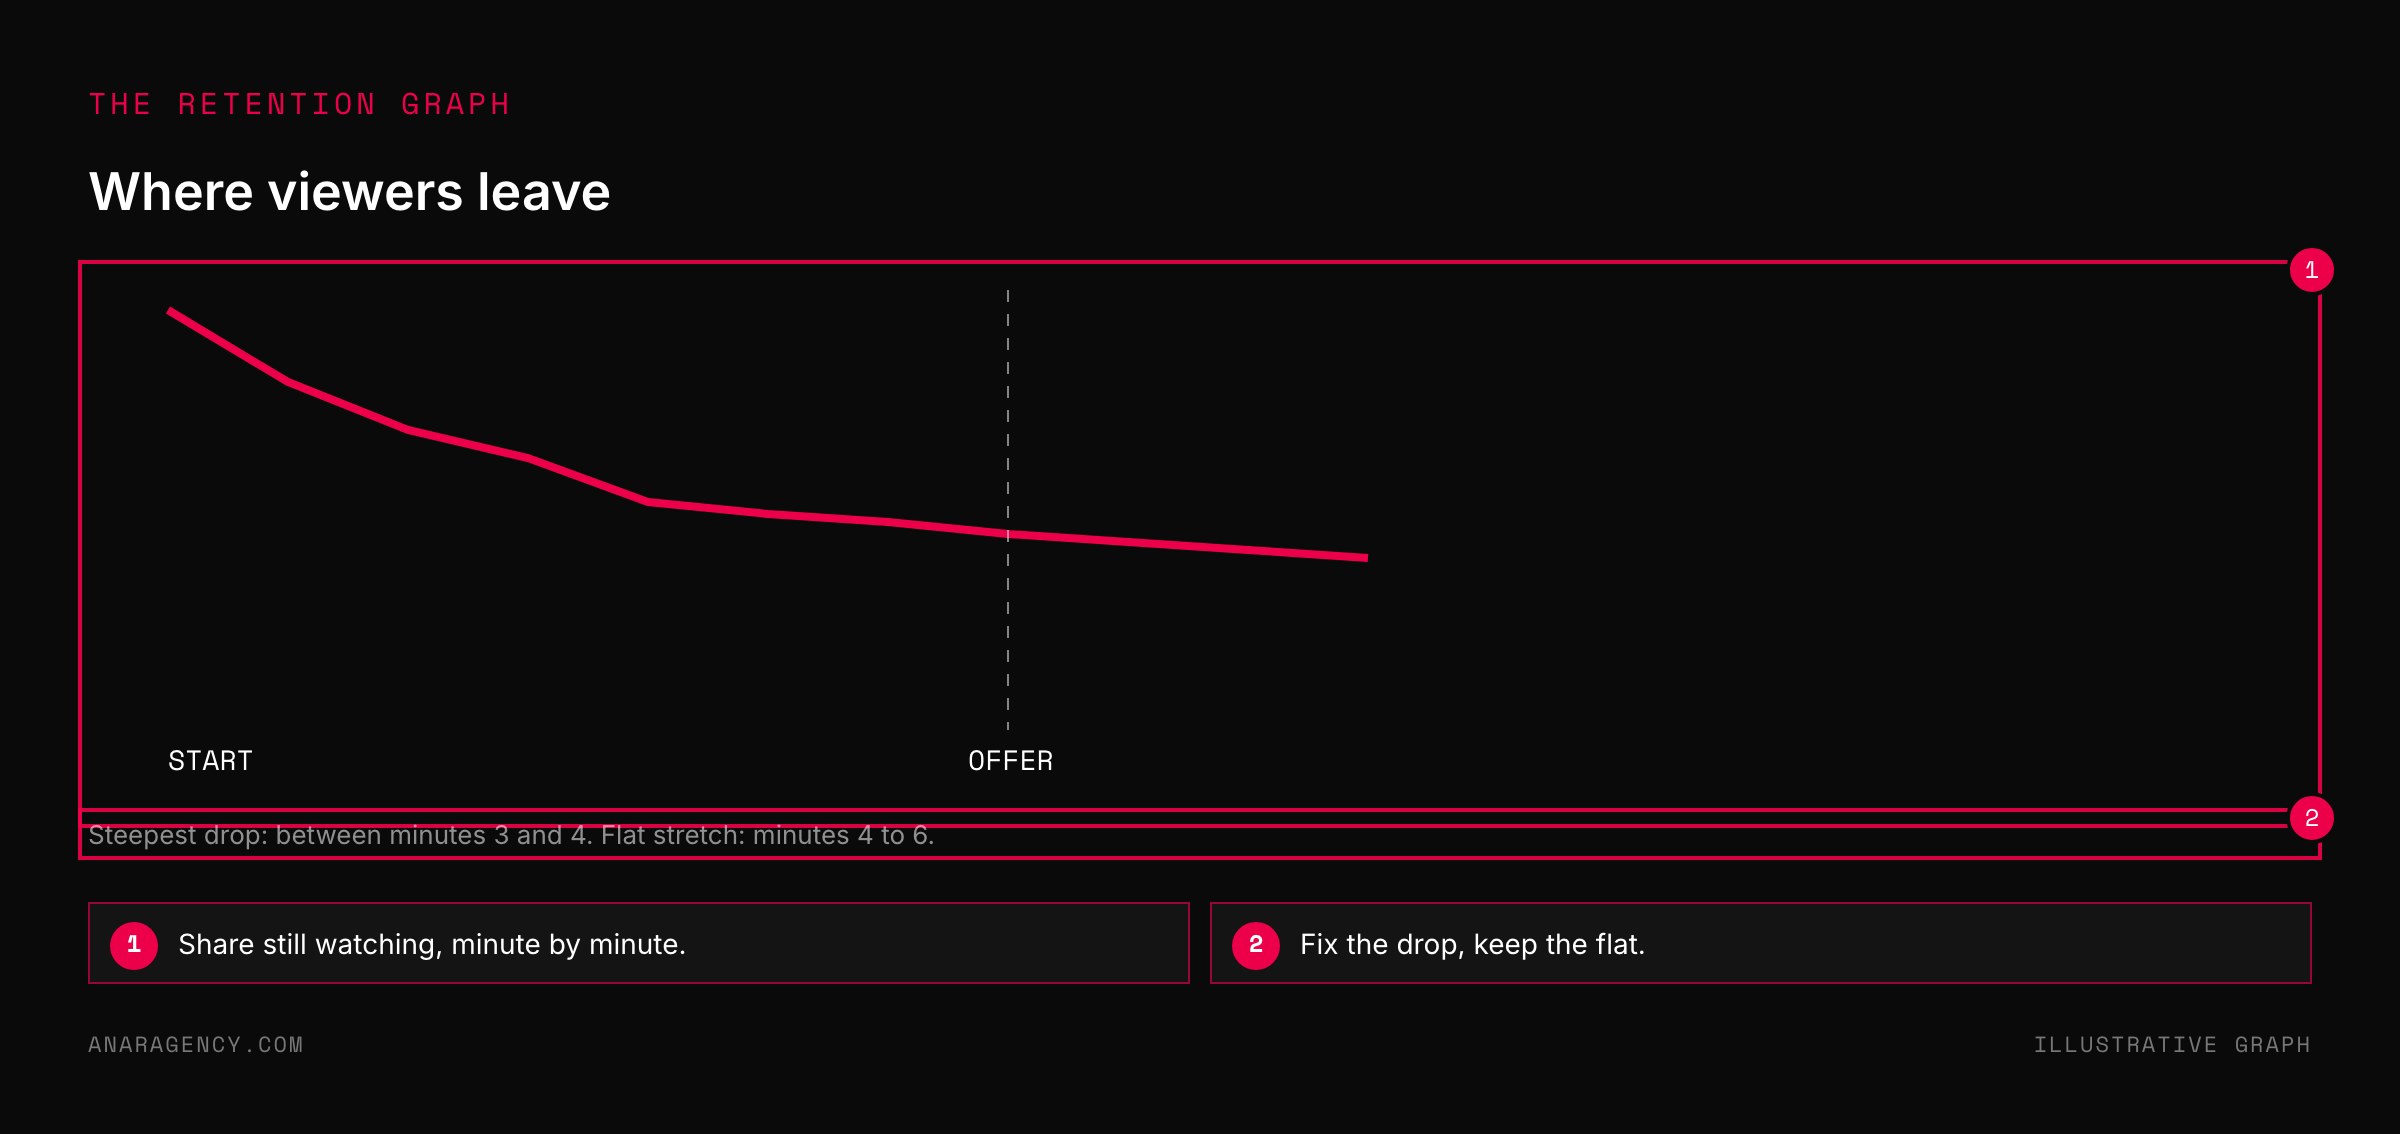
Most video platforms show how many viewers are still watching at each moment. YouTube calls it audience retention and shows key moments where viewers drop off or keep watching.
Look for three things. The share still watching when the offer first appears, the steepest drop in the whole video, and any flat stretch where nobody leaves.
The steepest drop is usually your most expensive minute. Something there is losing people you paid for.
The flat stretches tell you what is working. Use more of that.
Write the share at the offer next to your cost per click every week. It is the single number that tells you whether an edit helped.
Check the graph by traffic source too. Viewers from a cold ad and viewers from your email list often leave at very different points.
If your list watches to the end but cold viewers leave early, the opening is not doing its job for strangers.
Four ways to bring the number down
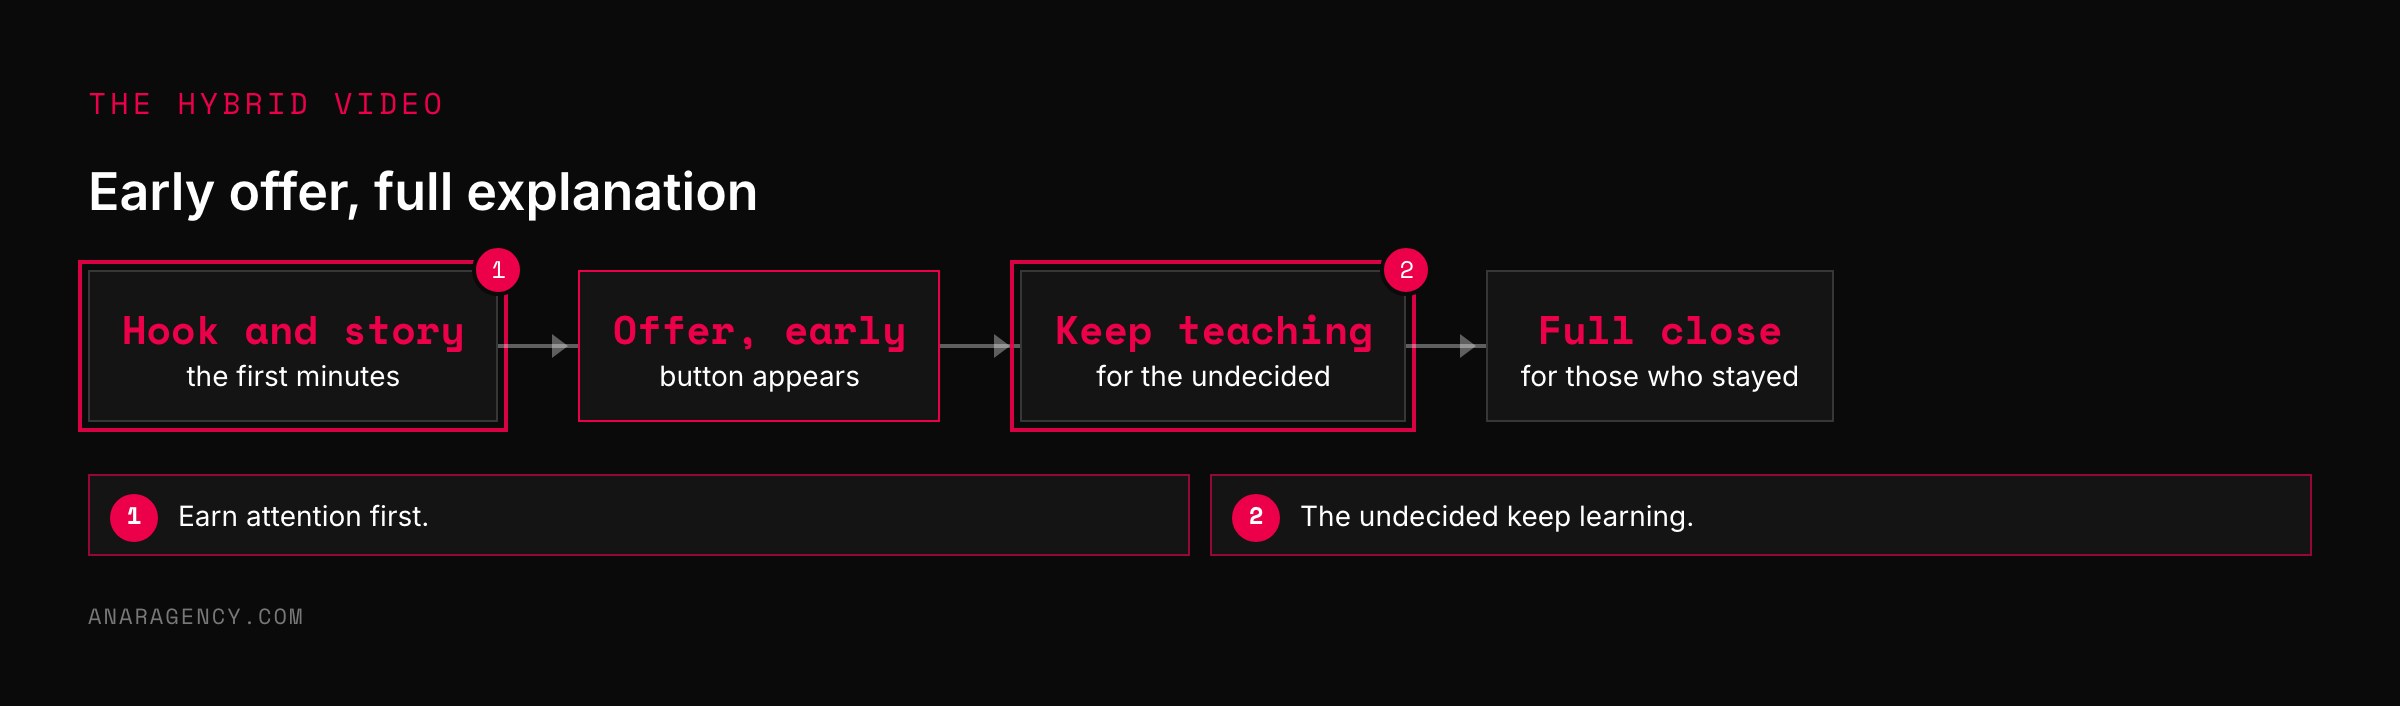
Move the offer earlier. Introduce the offer once most viewers are still there, then keep teaching for those who want more. A call to action does not have to wait for the end.
Cut the slow minute. Rewrite or remove the part of the video with the steepest drop.
Add an early button. Let viewers who are ready act before the end, instead of making them sit through the rest.
Retarget the leavers. A short follow-up ad shown to people who left before the offer may bring some back for less than it costs to find new viewers.
Change one thing at a time. Then compare the share at the offer, and the cost per buyer, against the week before.
"Shorter videos sell less, though."
Sometimes they do. A short video may not explain enough to justify a high price.
The formula does not say shorter is always better. It says every extra minute before the offer has a cost you can now see.
So test it. Run the long version and a version with the offer moved earlier, and compare cost per buyer, not views or clicks.
Often the answer is a hybrid: the offer appears early for those who are ready, and the explanation continues for those who are not.
For the close itself, see the stacked close. For the whole structure, see the twelve-beat VSL.
What to read next, and why
Measure key moments for audience retention (YouTube help): How to read where viewers stay and leave.
Pay-per-click (encyclopedia entry): The click pricing the formula starts from.
Sales letter (encyclopedia entry): The print format the sales video grew out of.
Call to action (encyclopedia entry): The moment the formula measures.
So the simple takeaway is this: find the share of viewers still watching when your offer appears, divide your cost per click by it, and write that number down every week.
Questions executives ask
How does video retention affect ad cost?
Only viewers still watching when the offer appears can act. Divide cost per click by the share still watching at that moment to get the real cost of each viewer who reaches the offer.
How long should a VSL be?
Long enough to justify the price, and no longer. Longer videos raise intent among those who stay but lose viewers you paid for, so test lengths and compare cost per buyer.
Where should the call to action go in a video?
Often earlier than the very end. Introducing the offer while most viewers are still watching, then continuing to teach, lets ready viewers act and others keep learning.
What is audience retention?
The share of viewers still watching at each moment of a video. YouTube and other platforms show it as a graph.
How can I improve VSL retention?
Find the steepest drop on the retention graph and rewrite or cut that part, move the offer earlier, add an early button, and retarget viewers who left before the offer.

Filip Kovacevic is the founder of Anar Agency in Phoenix. He spent five years running SEO, Meta ads, email, and content for medical practices across the United States, and now does the same work for healthcare, home-service, legal, and professional-service businesses, alongside AI implementation. More from Filip →
Talk it through in 15 minutes
Bring one AI question from this article. We will tell you what we would do, whether or not you hire us.
Book a 15-Min Chat →