Google Ads Cost Per Click by Industry in 2026, and How to Use the Number
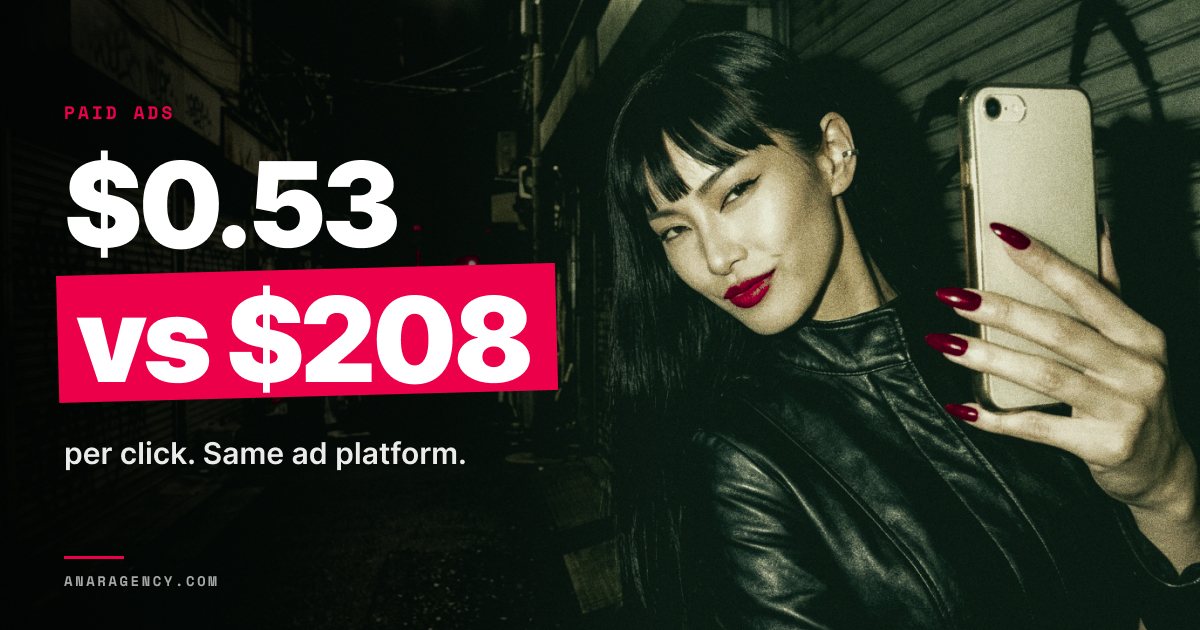
In our September 2026 pull, the average top-of-page Google Ads cost per click ran from $0.53 for Amazon sellers to $208 for car accident law, across the 50 US industry segments we track. The table refreshes monthly, so the live figures on our benchmarks page will have moved a little since. The all-industry average you see quoted, about $5 a click, is real and useless for planning, because it blends a $2 restaurant click with a $150 insurance click.
The number that matters is the break-even CPC for your own offer: what a customer is worth, times how many leads become customers, times how many clicks become leads.
What a Google Ads click costs in 2026, by industry
Every month we pull the average top-of-page bid for a basket of two or three head terms in each of 50 industry segments, straight from Google Ads Keyword Planner data. The numbers in this article are the September 2026 pull, and the spread is enormous.
A car accident lawyer pays around $208 for a click at the top of the page. A home insurance advertiser pays about $151. A plumber pays $41, a dentist $14, a med spa under $9, and an Amazon seller advertising a listing pays 53 cents.
Same platform. Same auction. A price that differs by a factor of almost four hundred.
The pattern is not random. CPC tracks what a single new customer is worth and how many advertisers are willing to pay for that customer. A signed personal injury case can be worth tens of thousands of dollars, so firms bid accordingly.
A dermatology appointment is worth a few hundred dollars, and the click price reflects it.
So when you read the chart below, read it as a map of customer value, not a list of good and bad industries.
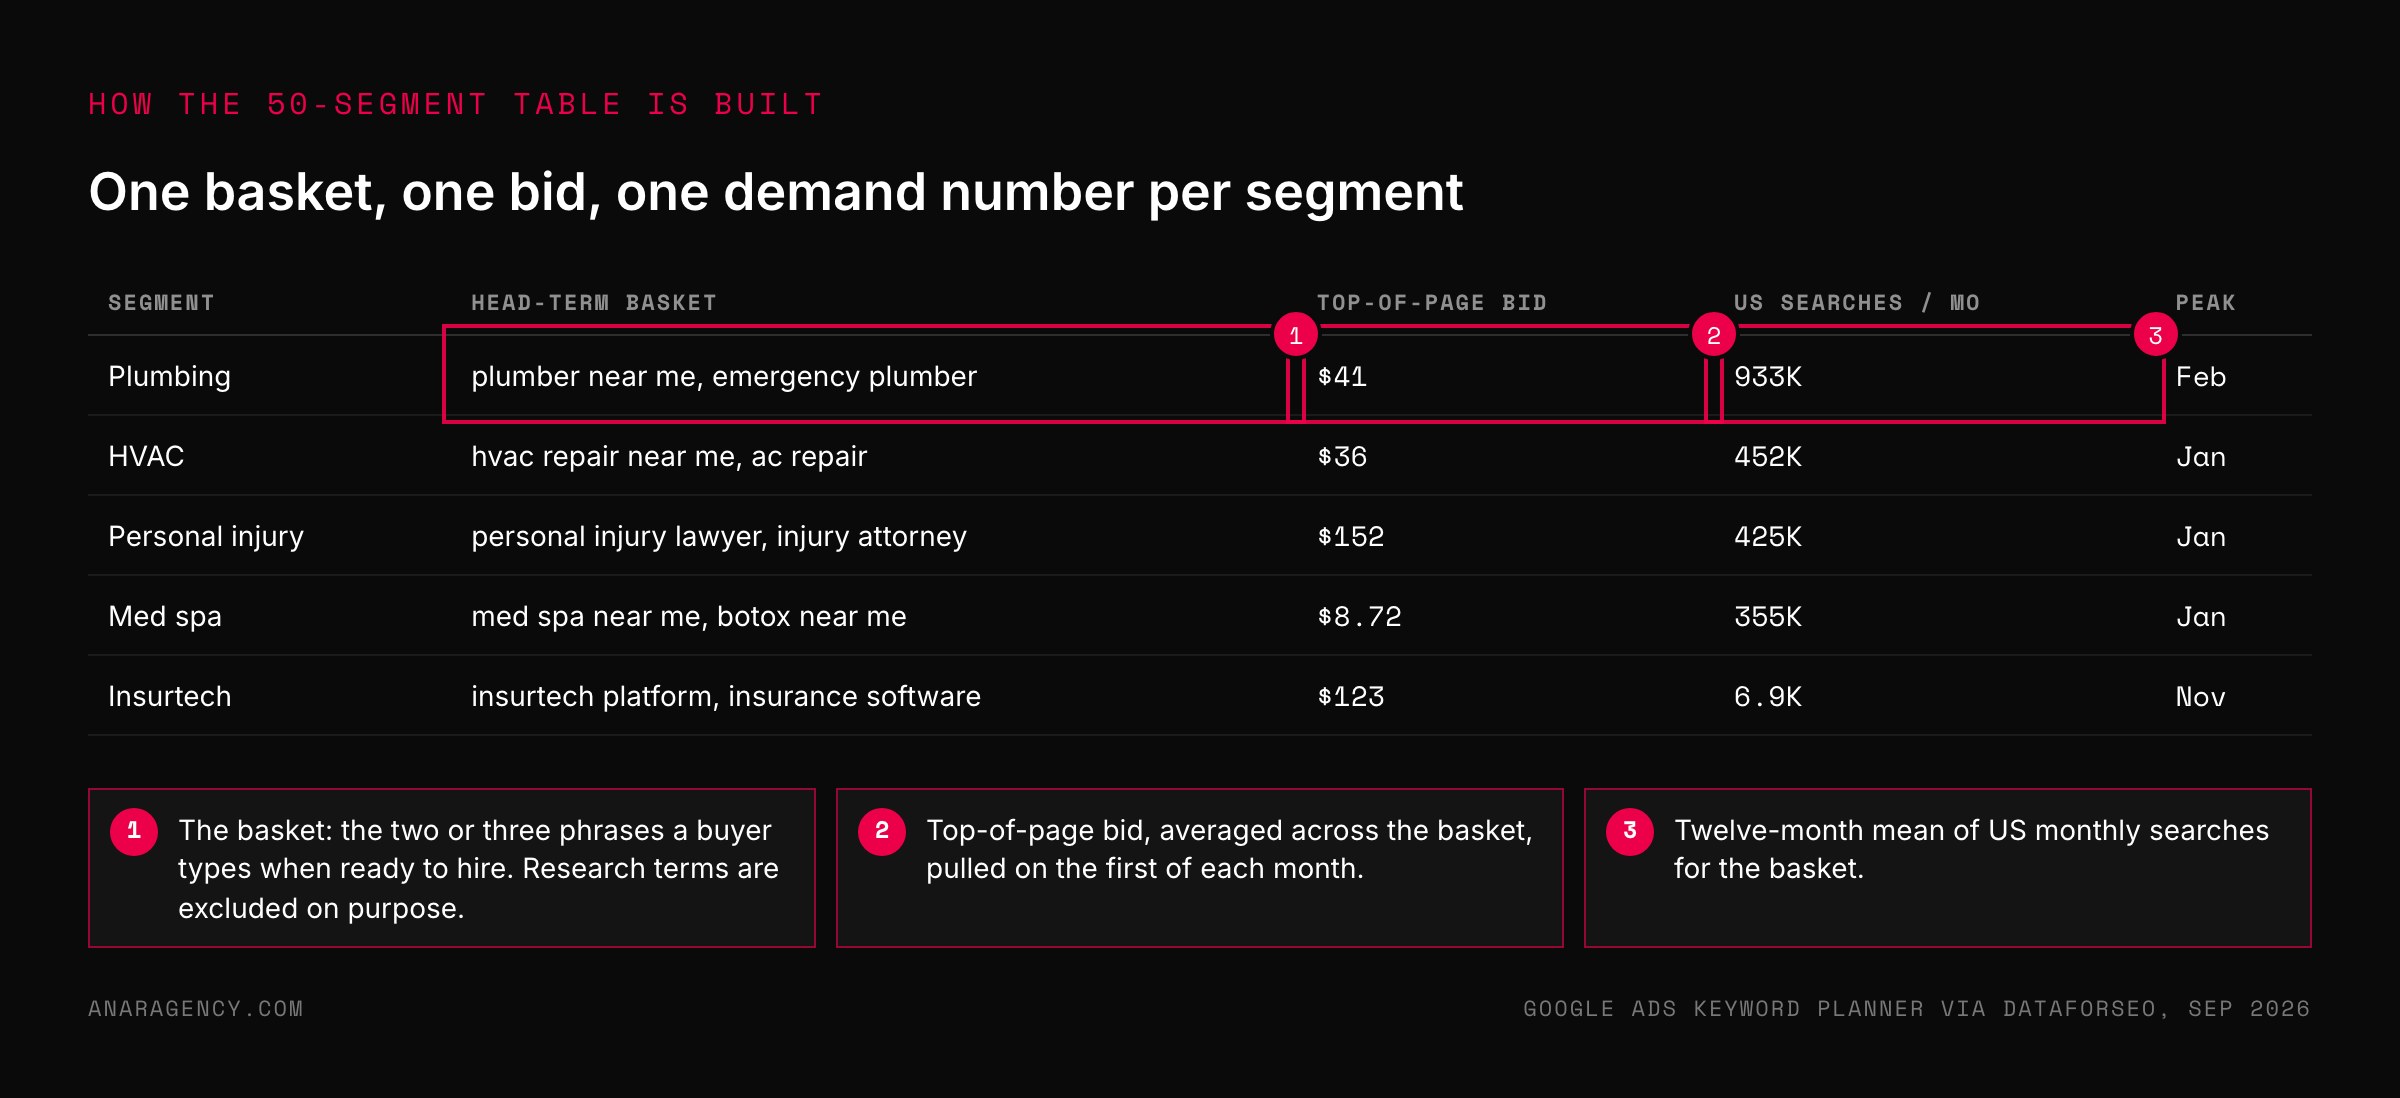
Two columns we track but do not chart here matter just as much: search volume and peak month. Plumbing has 933,000 US searches a month for its head terms at $41 a click. Insurtech has 6,900 searches at $123.
One is a volume game, the other a precision game.
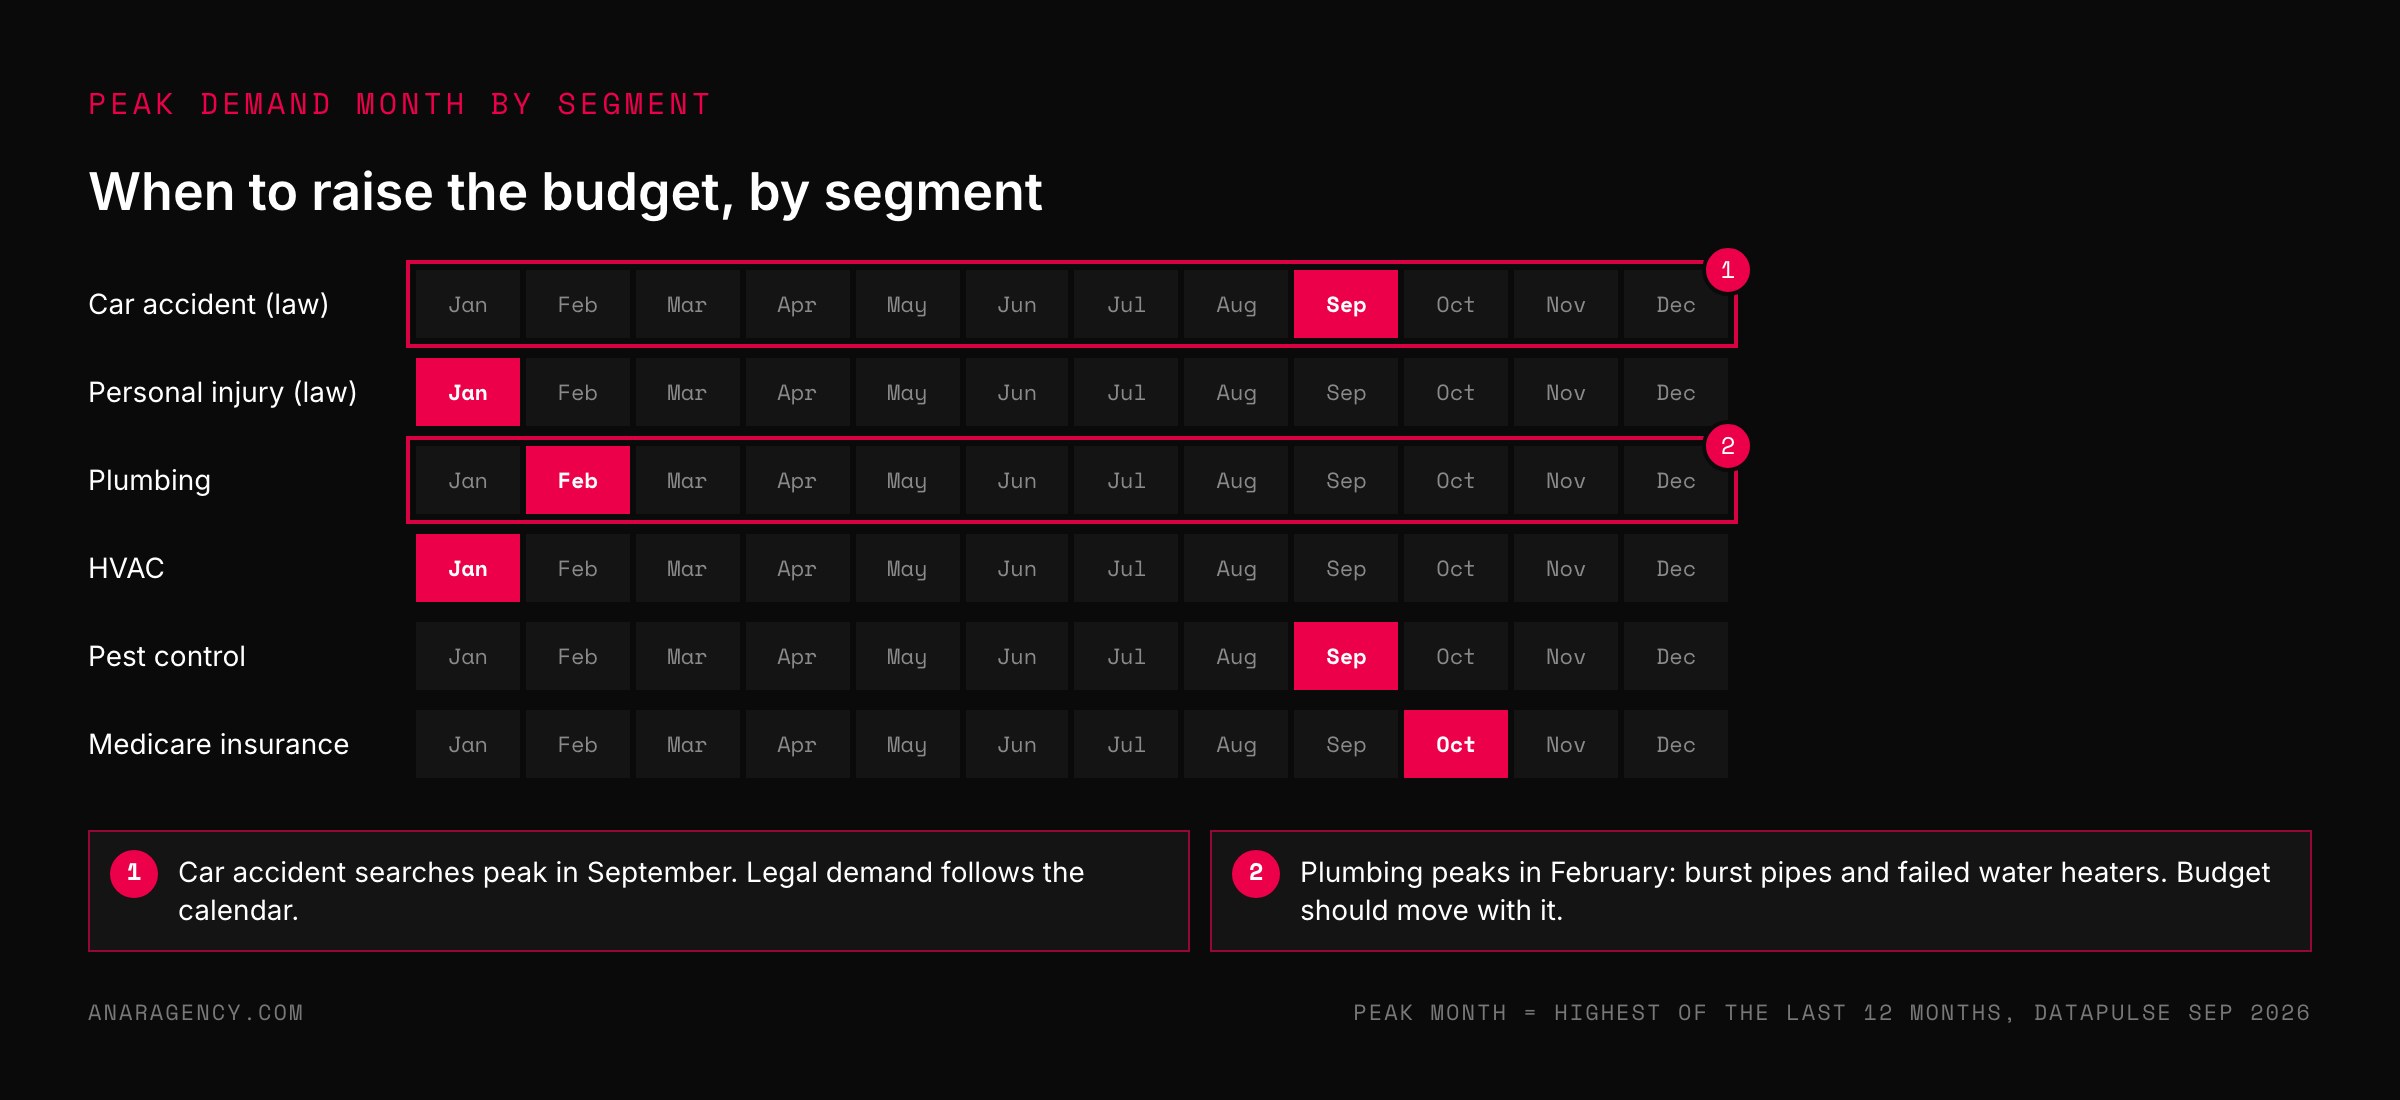
Legal and home-service demand also moves with the calendar, so an account that raises budget in its peak month and trims it in the trough buys the same leads for less.
Why the average CPC you read about does not match your account
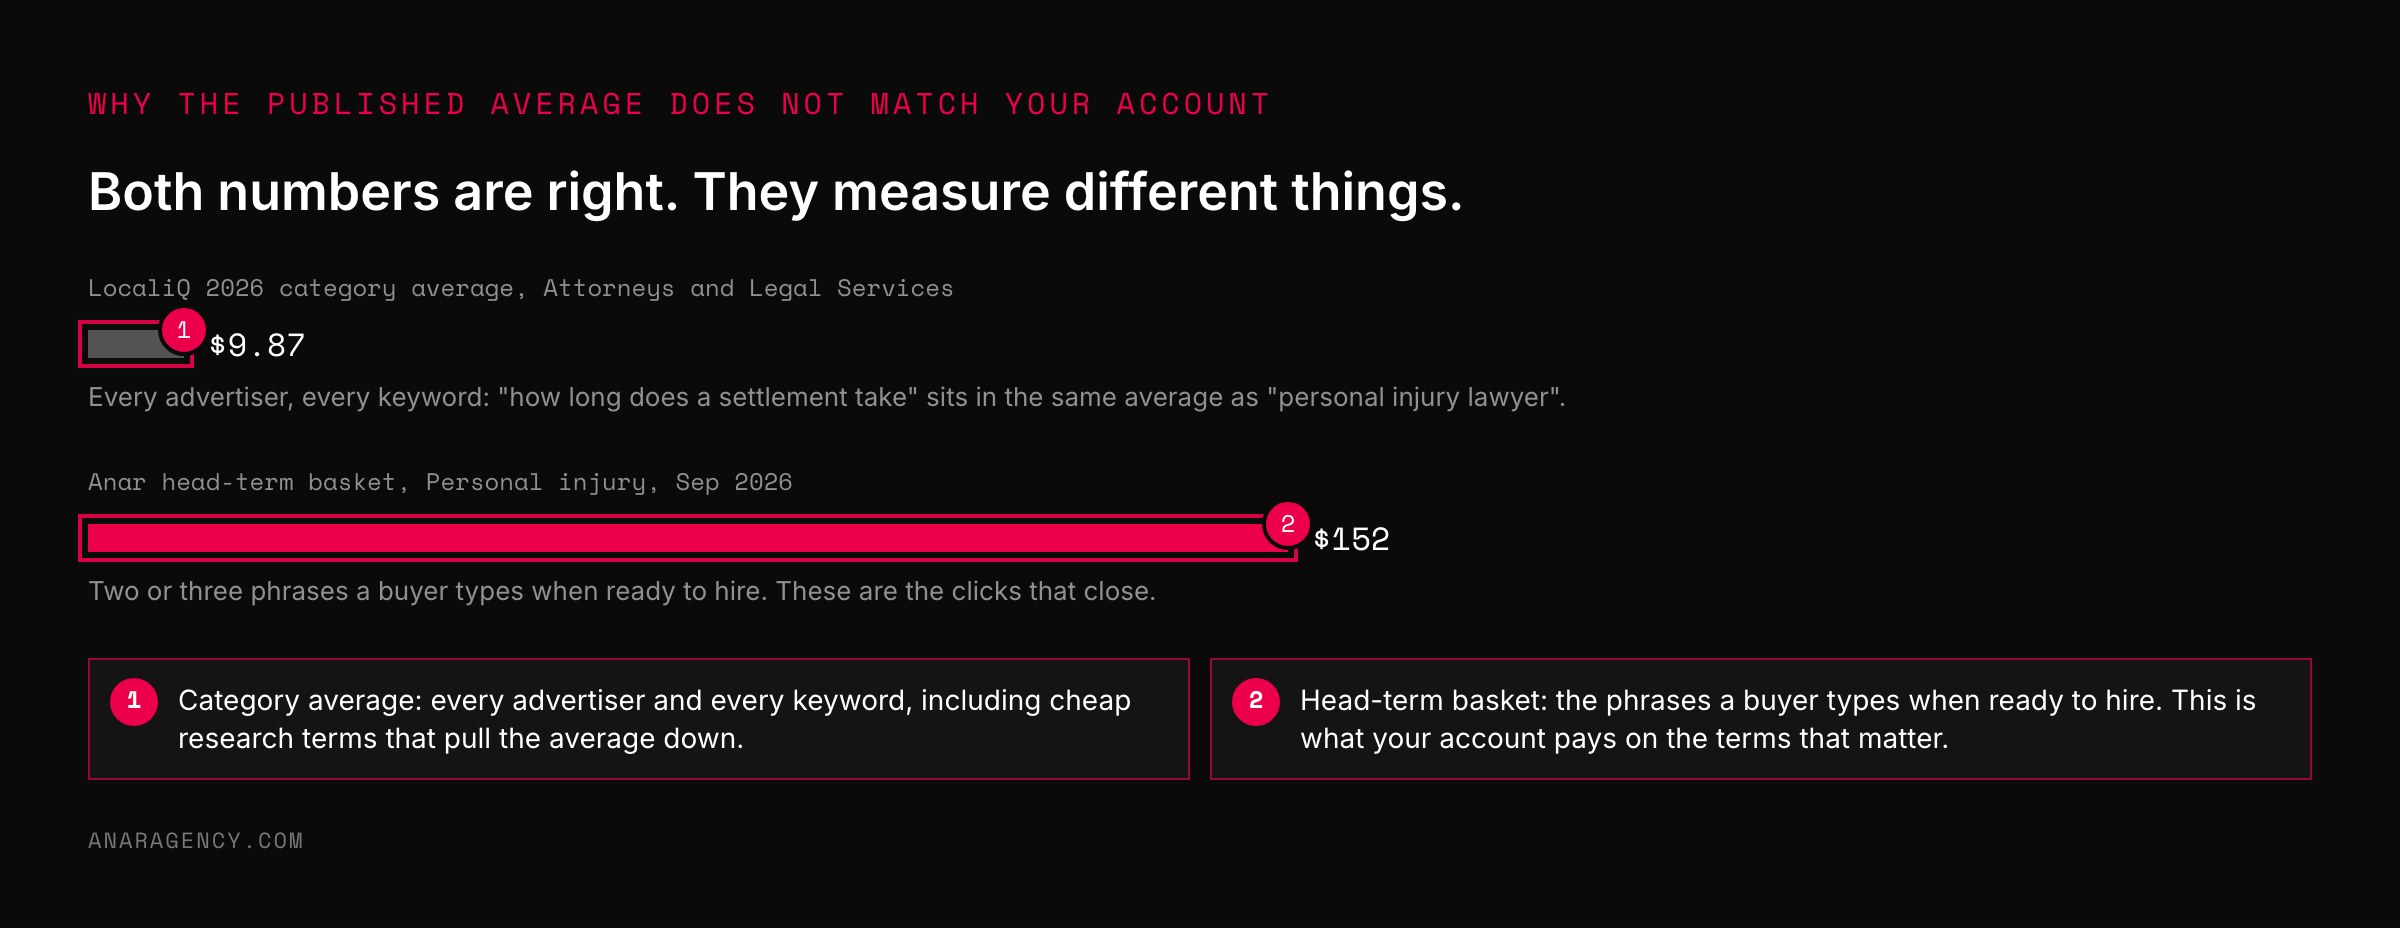
The most quoted benchmark this year comes from LocaliQ, which reports an all-industry average CPC of $5.42 for 2026 and a legal services average of $9.87. Our basket for personal injury terms sits at $152.
Both numbers are honest. They measure different things, and knowing the difference is the whole skill of using benchmarks.
A category average blends every advertiser and every keyword in the category: the firm bidding on "personal injury lawyer" and the firm bidding on "how long does a settlement take." Long-tail and research terms are cheap and plentiful, so they pull the average down.
A head-term basket isolates the two or three phrases a buyer types when they are ready to hire. Those are the clicks that close, and they cost what the chart above says they cost.
So when your account shows a $90 CPC and a report says the industry average is $10, nothing is broken. You are buying head terms, and the report is averaging everything. The useful comparison is your head-term CPC against the head-term basket for your segment, and your long-tail CPC against your own history.
Google's own definition of click-through rate makes the same point from the other side: a CTR is only meaningful against the keyword and position it was measured at.
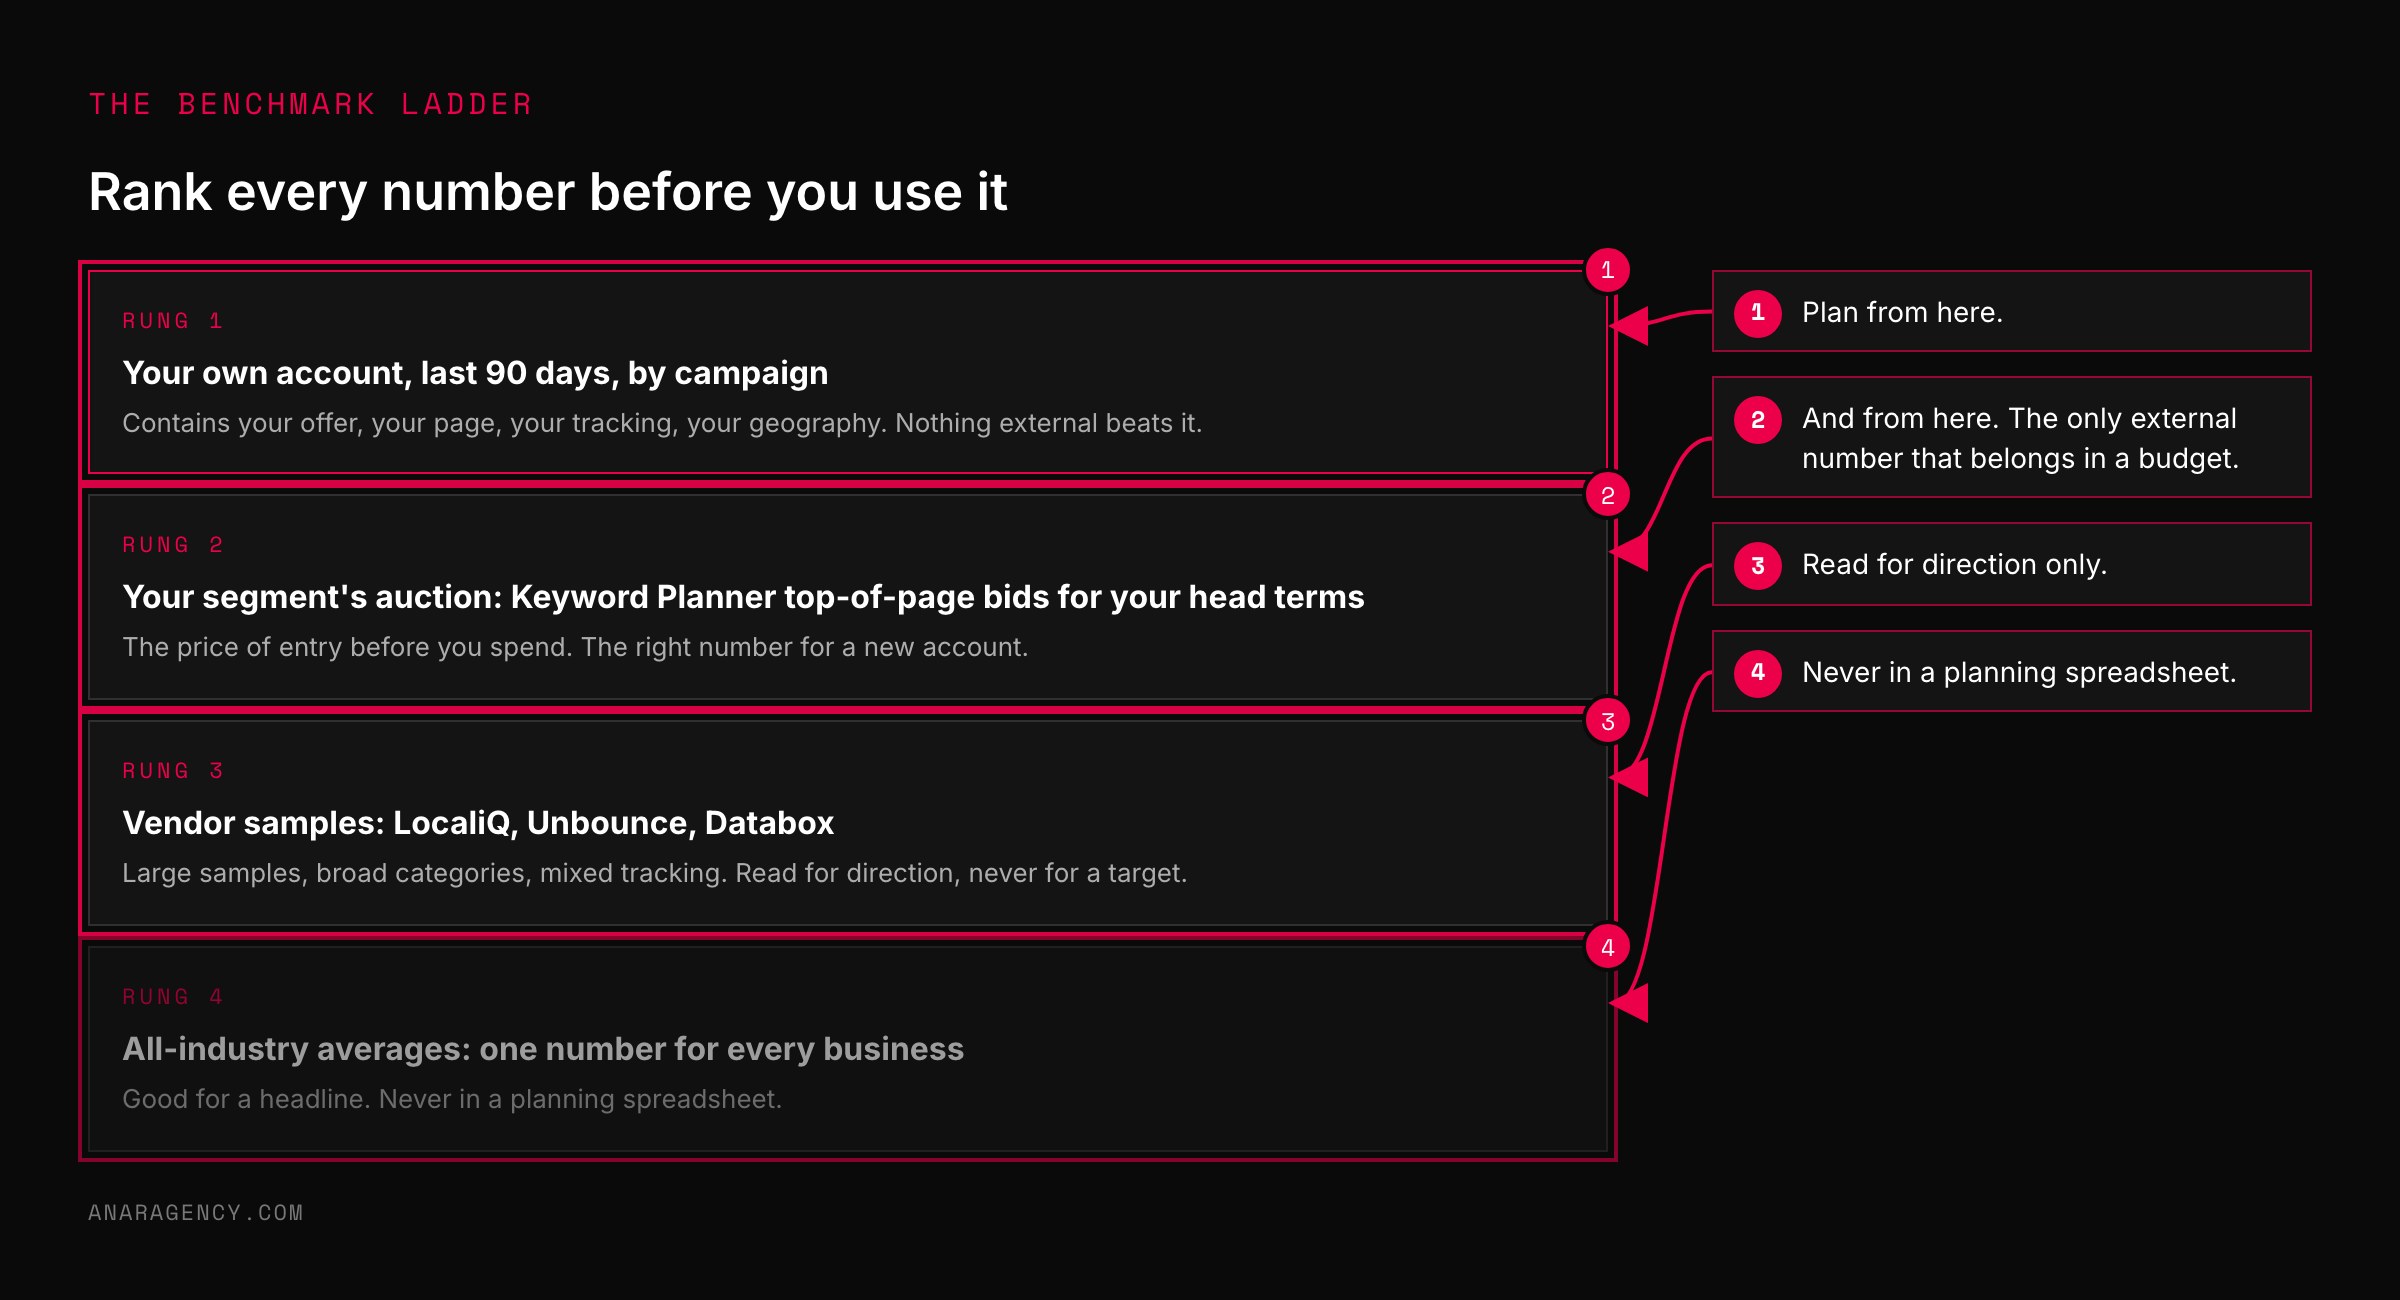
Rank every number before you use it. Rung 1 is your own account over the last 90 days, segmented. Rung 2 is your segment's auction price for your real head terms.
Rung 3 is a vendor sample like LocaliQ or Unbounce. Rung 4 is an all-industry average. Plan from rungs 1 and 2.
Read rung 3 for direction. Never put a rung 4 number in a budget.
The Benchmark Ladder: four rungs of trust
Benchmarks are not all equal, and treating them as if they were is how budgets get set wrong. We rank every number we see on a four-rung ladder, from the one you should trust most to the one you should trust least.
Rung 1, your own account. Last 90 days, segmented by campaign and match type. Nothing external beats it, because it already contains your offer, your landing page, your tracking, and your geography.
Google Ads reports it for free, and the only work is reading it by segment instead of as one blended number.
Rung 2, your segment's auction. Keyword Planner top-of-page bids for your actual head terms in your actual market. This is what our 50-segment table is.
It tells you the price of entry before you spend a dollar, and it is the right number for a new account with no history.
Rung 3, vendor samples. LocaliQ, Unbounce, Databox and others publish averages from their customer base. They are large samples and worth reading, but the sample is their customers, the categories are broad, and the tracking setups vary.
Use them to sanity-check direction, never to set a target.
Rung 4, all-industry averages. One number for every business in the country. Good for a headline, useless for a budget.
If a number is on rung 4, it should never appear in your planning spreadsheet.
How to turn a CPC into a budget you can defend
A CPC on its own cannot tell you whether a campaign is affordable. Three numbers together can: what one new customer is worth to you, what share of leads become customers, and what share of clicks become leads.
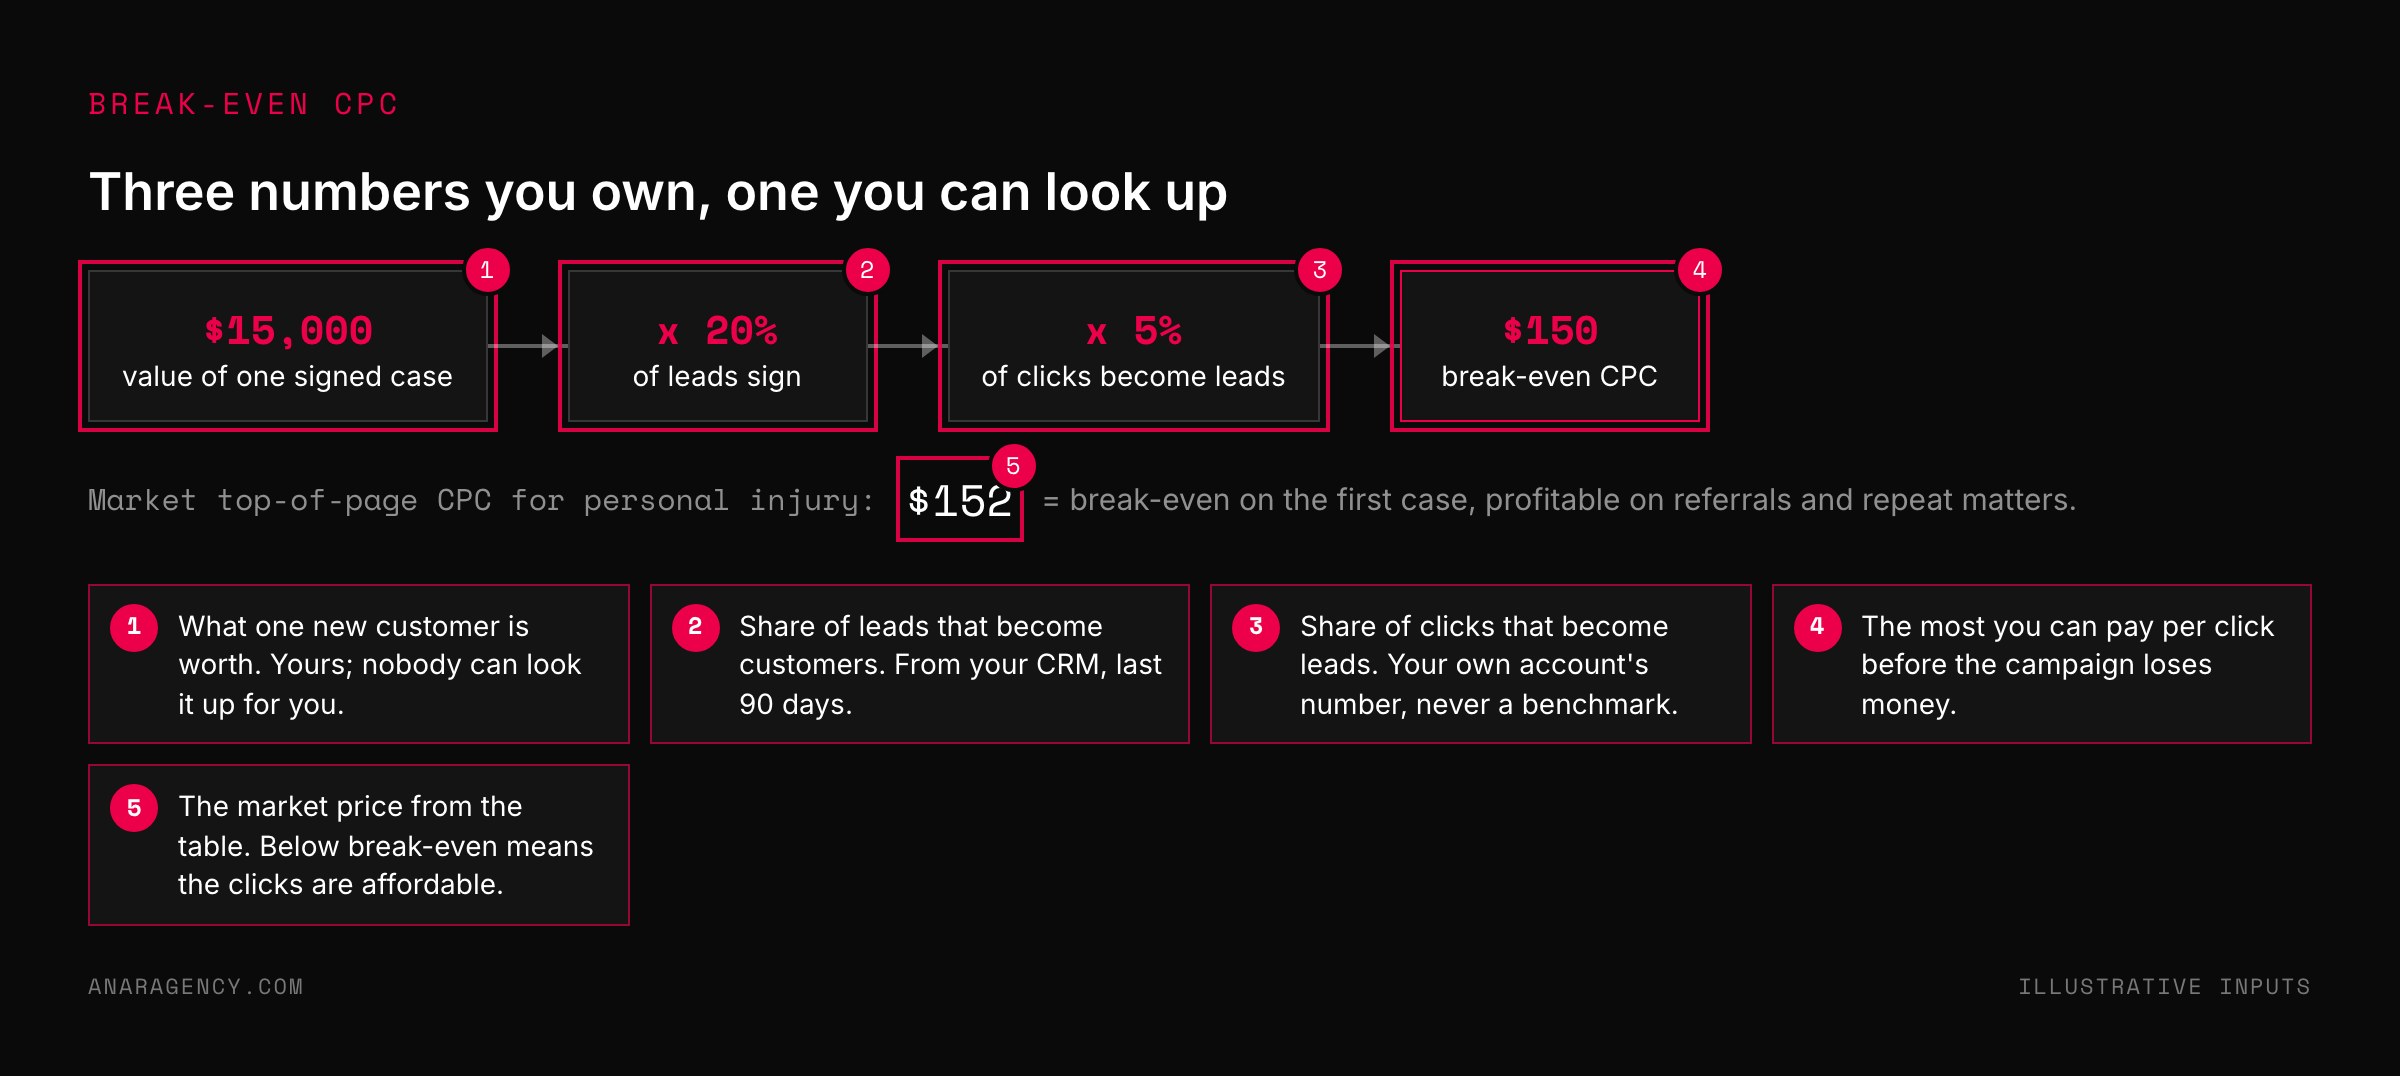
Multiply them and you get the most you can pay for a click before the campaign loses money. We call it the break-even CPC, and it is the number every budget conversation should start with. Our ad spend calculator runs it for you.
Take a personal injury firm where a signed case is worth $15,000, one lead in five signs, and one click in twenty becomes a lead. That is $15,000 x 0.20 x 0.05, or $150 per click. At a $152 market CPC the firm is at break-even on the first case and profitable on referrals and repeat matters.
A plumber with a $600 average job, a 60 percent booking rate, and a 15 percent click-to-lead rate gets $54. At a $41 market CPC there is room. A med spa with a $900 first visit, 40 percent booking, and 12 percent click-to-lead gets $43, which is comfortably above its $8.72 head-term CPC.
Two of those three inputs are yours, and nobody can look them up for you: customer value and close rate. The third, click-to-lead rate, is where people reach for a benchmark, and it is the one benchmark we refuse to publish, for reasons in the last section.
Use your own account's number. If you have no account yet, run the math at 3 percent and 8 percent and plan for the worse case.
Google's guide to return on investment walks the same arithmetic from the revenue side. And if you track conversion values instead of just conversion counts, the platform can bid toward the break-even for you with Target ROAS.
What moves your CPC inside the auction
Your CPC is not a price tag. It is the outcome of an auction that runs every time someone searches.
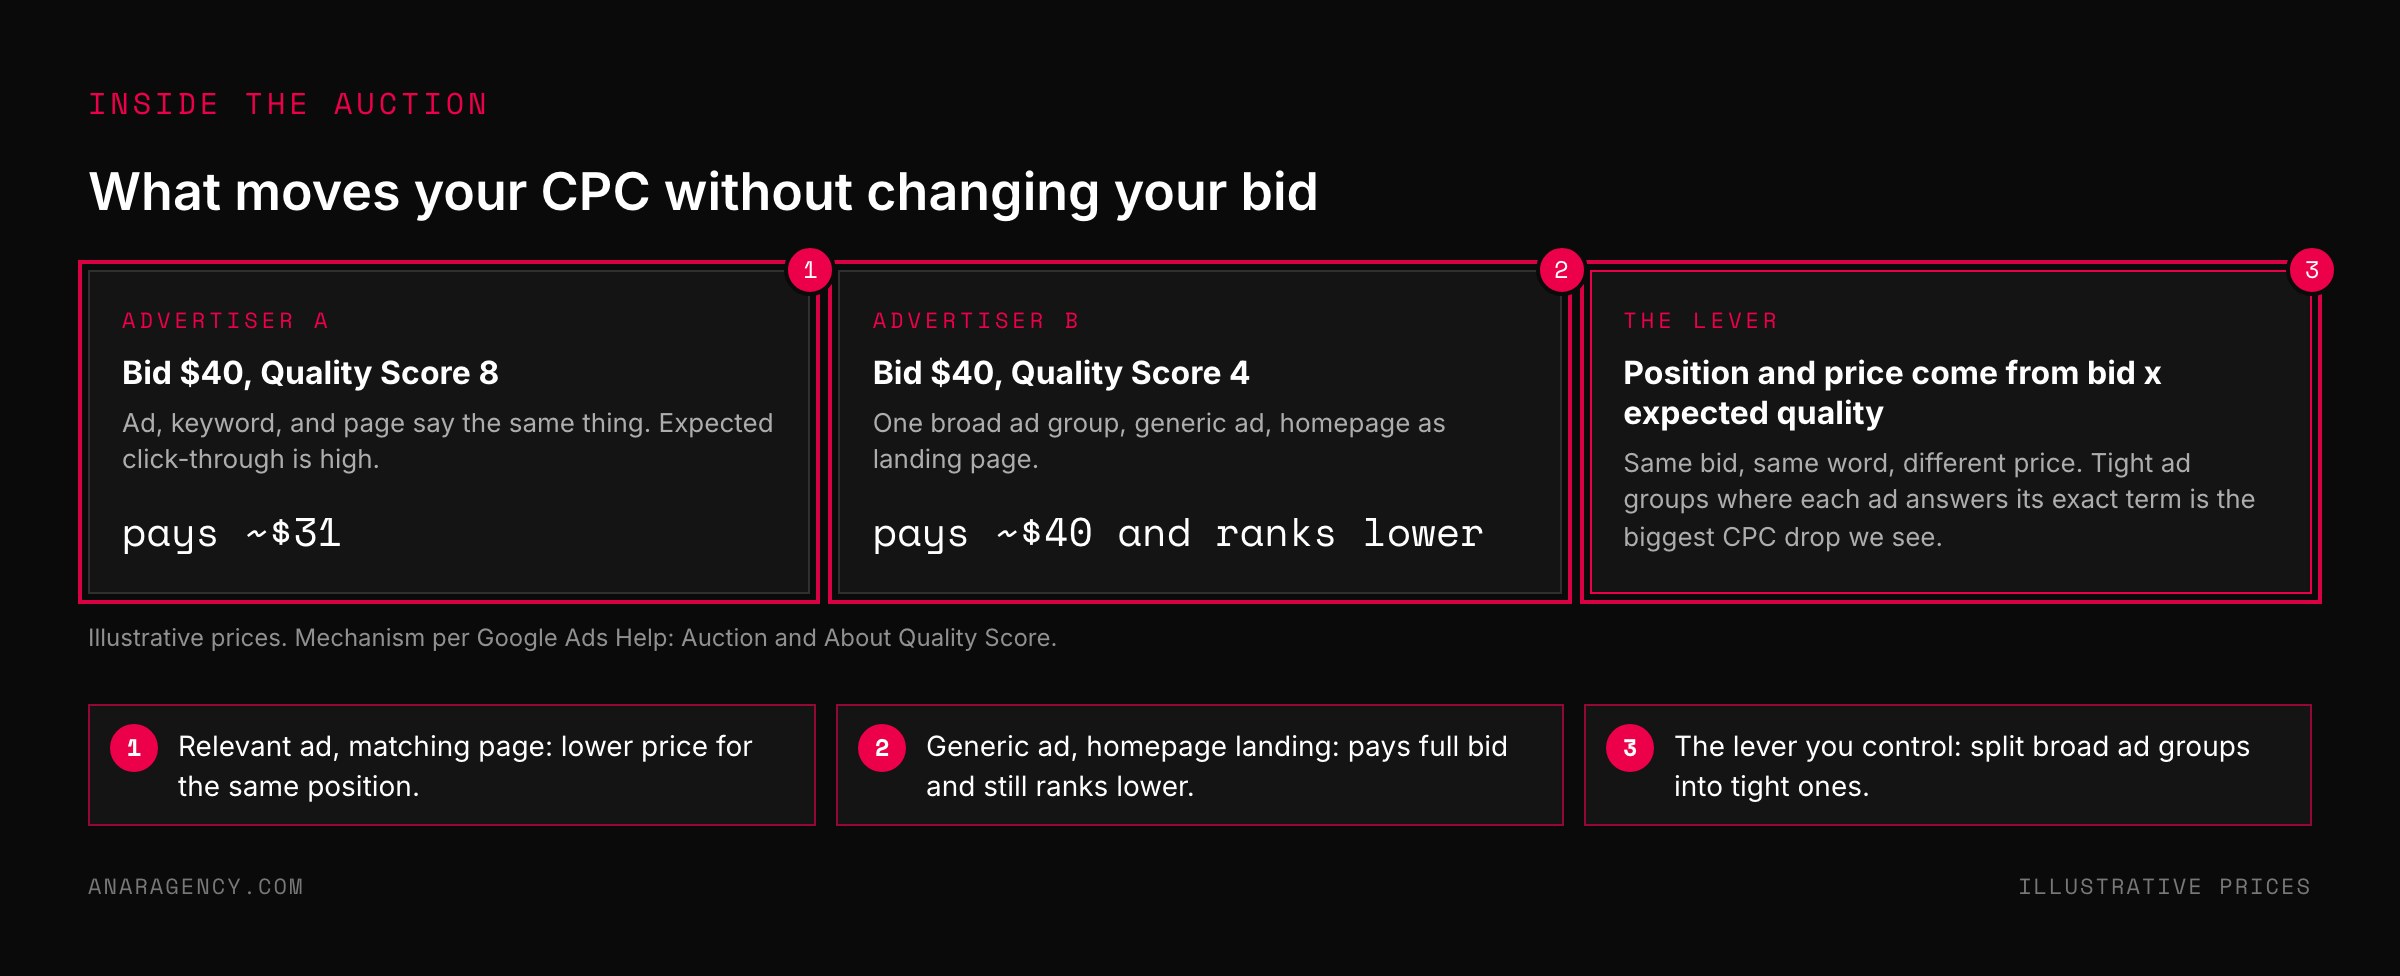
Google's auction documentation is short and worth reading in full: your position and what you pay depend on your bid, the expected quality of your ad and landing page, the competition, and the context of the search. Two advertisers bidding the same amount on the same word routinely pay different prices.
The lever you control most directly is Quality Score, Google's one-to-ten read on expected click-through rate, ad relevance, and landing page experience. A low score means you pay more for the same position.
Google publishes five ways to use Quality Score that amount to one instruction: make the keyword, the ad, and the page say the same thing. In our client accounts the single biggest CPC drop has come from splitting one broad ad group into tight groups where each ad answers exactly the term it shows for.
Ad format matters too. Responsive search ads let Google assemble the headline and description combination most likely to earn the click, and assets like sitelinks, callouts, and call buttons expand the ad and lift expected CTR, which feeds back into a better position at the same bid.
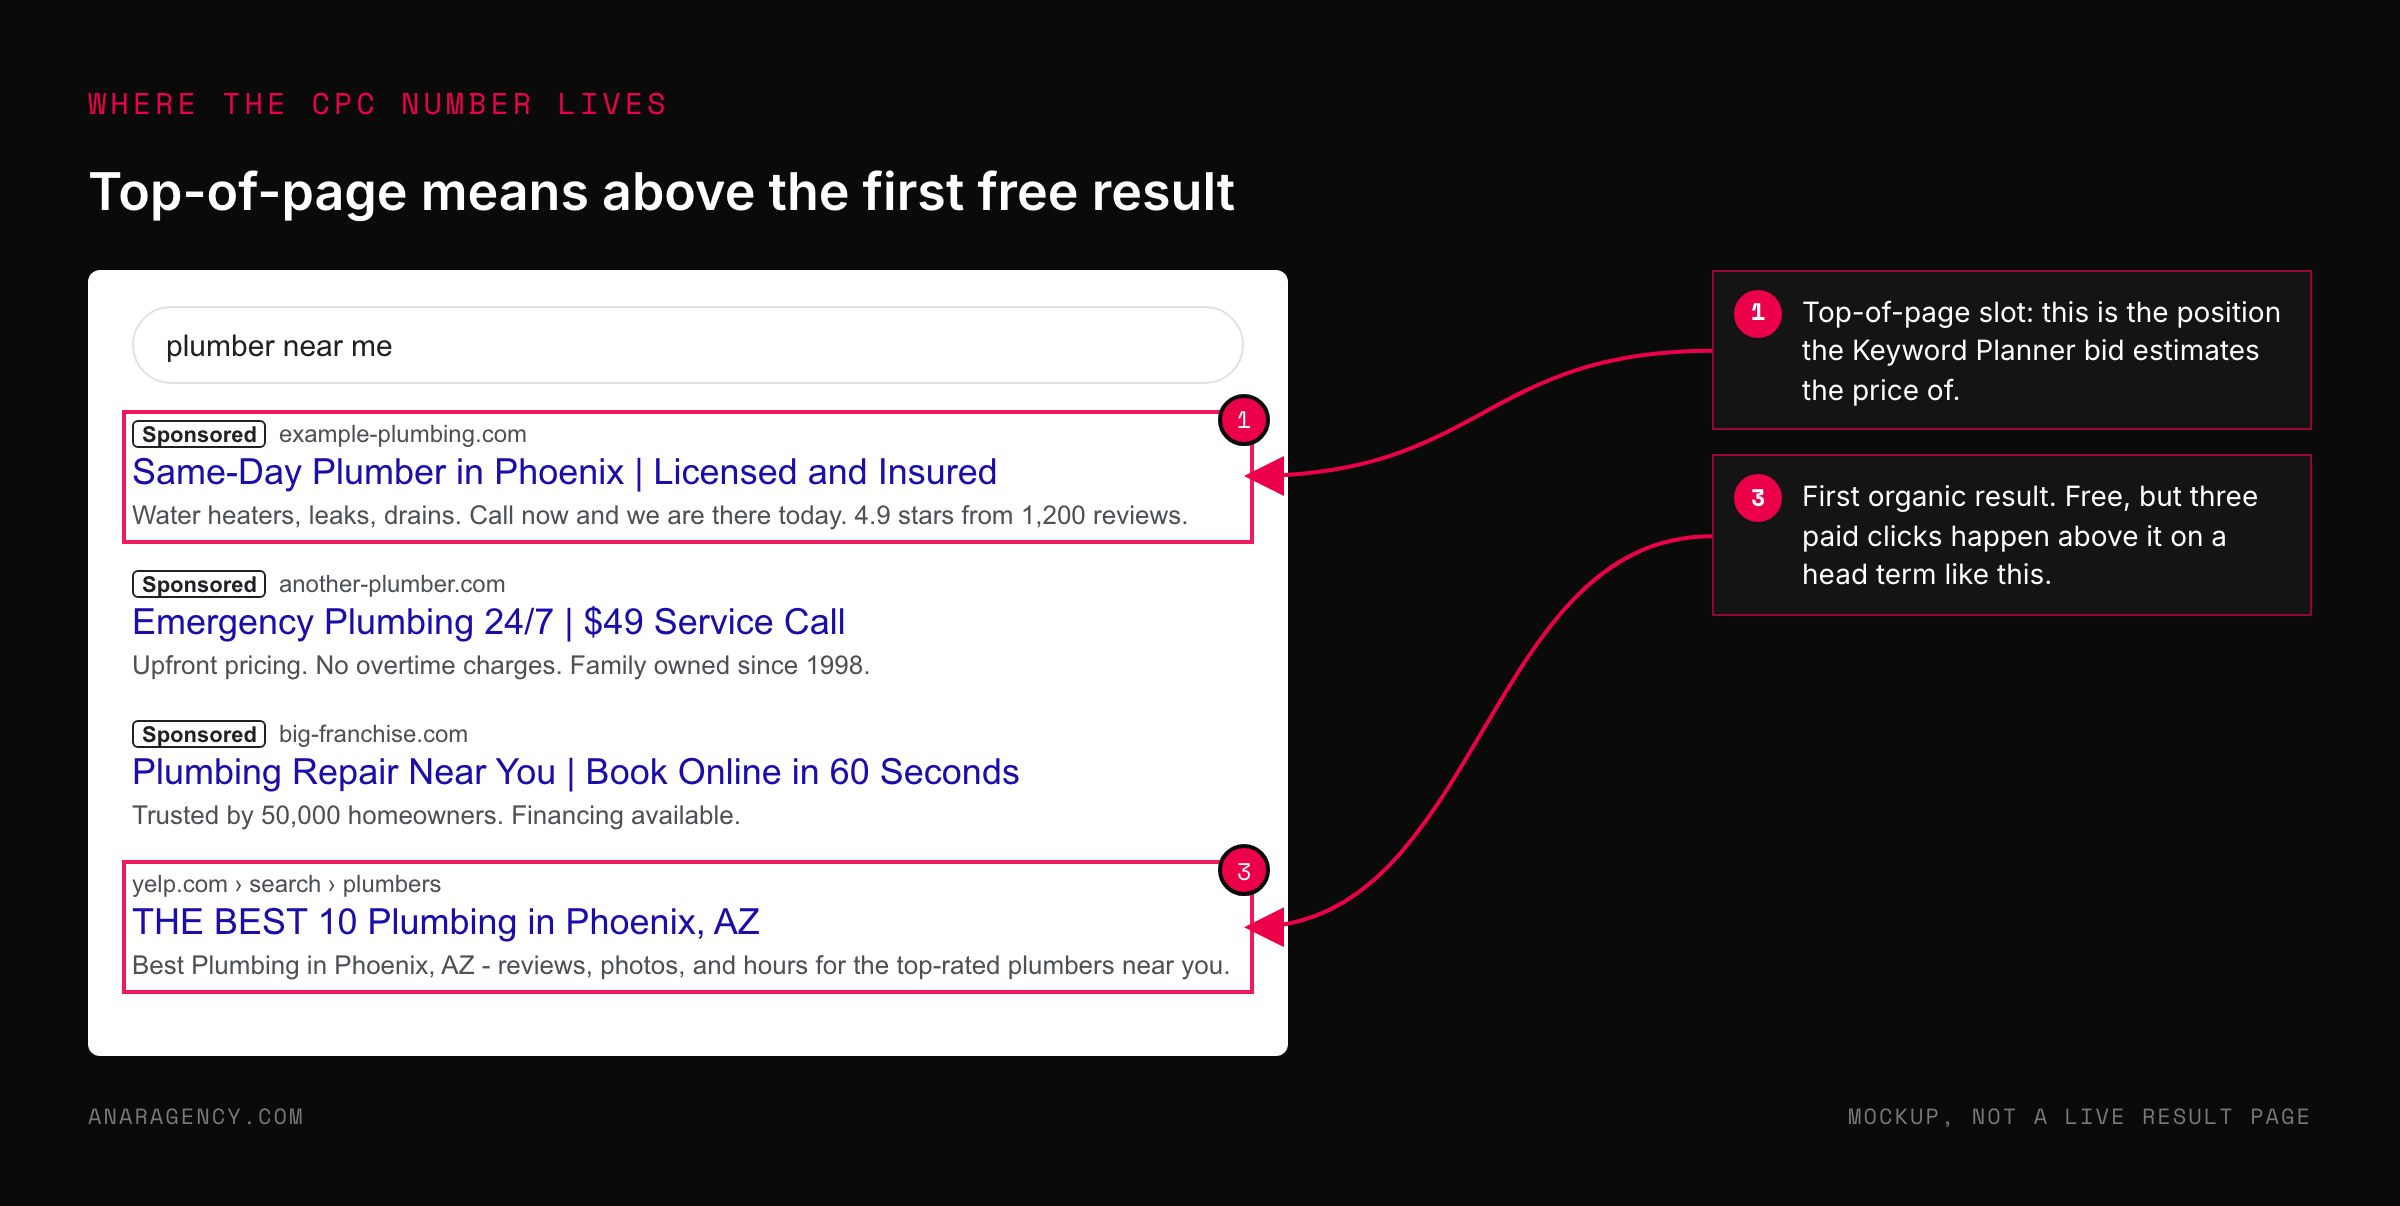
None of this changes what your segment costs at the top of the page. It changes how much of that price you pay.
Why we do not publish conversion rate or cost per lead benchmarks
You will find them elsewhere. LocaliQ reports a 2026 all-industry conversion rate of 8.18 percent and an average cost per lead of $66.69.
Unbounce's Conversion Benchmark Report, built from 57 million conversions across 41,000 landing pages, puts the median landing page conversion rate at 6.6 percent, with paid search traffic converting at 10.9 percent and Google search specifically at 11.3 percent. Those are serious datasets, and we cite them here because you should know they exist.
We still do not publish our own, and we do not plan a campaign on theirs.
A conversion rate depends on what counts as a conversion, and that differs by account: a form fill, a phone call over 60 seconds, a booked appointment, a chat. Google Analytics calls these key events and lets each site define its own, which is exactly why two accounts reporting "8 percent" can be measuring different things.
Averaging across offers, pages, and definitions produces a number that describes nobody.
The honest version of a conversion benchmark is one line: your own account, by campaign, over the last 90 days. Everything above that on the ladder is context. We publish what we can pull from a named source with its period stated, which for conversion rate means nothing, and for cost per click means the 50-segment table this article is built on.
The Census Bureau's County Business Patterns tells you how many competitors share your market, and that we publish too, because it comes from a source we can name.
Questions executives ask
What is a good Google Ads cost per click?
There is no single good CPC. Across the 50 segments we track, top-of-page averages run from $0.53 to $208. A CPC is good only relative to your break-even: what a customer is worth, times your close rate, times your click-to-lead rate.
If the market CPC is below that number, the clicks are affordable.
Why is my CPC so much higher than the industry average?
Published industry averages blend cheap long-tail and research keywords with expensive head terms. If you bid on the terms buyers type when ready to hire, your CPC will sit far above the category average and close to the head-term basket for your segment. Compare like with like.
How many clicks do I need to get one customer?
Divide one by your click-to-lead rate, then divide again by your lead-to-customer rate. At 5 percent and 20 percent that is 100 clicks per customer. Multiply by your CPC and you have your cost per customer before any optimization.
Are conversion rate benchmarks useful at all?
As context, yes. As a target, no. Conversion definitions differ by account, so cross-account averages describe nobody.
Use vendor benchmarks to check direction and your own 90-day account data to set targets.
Where does your CPC data come from?
Google Ads Keyword Planner top-of-page bid data, pulled through the DataForSEO API on the first of each month for a basket of two or three head terms per segment, US only. The full 50-segment table with search volume, competition, and peak month is on our benchmarks page and is free to reuse with attribution.

Filip Kovacevic is the founder of Anar Agency in Phoenix. He spent five years running SEO, Meta ads, email, and content for medical practices across the United States, and now does the same work for healthcare, home-service, legal, and professional-service businesses, alongside AI implementation. More from Filip →
Talk it through in 15 minutes
Bring one AI question from this article. We will tell you what we would do, whether or not you hire us.
Book a 15-Min Chat →