Book-a-Call Math: Work Backward From Revenue to Leads

A business that sells on a call runs on four rates, and most owners have never written them down: how many leads book, how many bookings are real, how many real bookings show up, and how many shows close. Put your revenue goal at the top, divide backward through those four, and you get the one number that is checkable on a Tuesday: leads per day. A $600,000 year at $3,000 a deal, with ordinary rates, is about 15 leads a day.
Track the four rates weekly, and the one furthest from its target names the layer that owns the fix: traffic, funnel, or sales.
The question every owner answers with a shrug
Ask the owner of a firm that sells on calls how many leads they need next month and you get one word: more. Ask what a single lead is worth and you get a shrug. Not because the number is unknowable.
Because nobody wrote down the four rates that connect a lead to a deal, so every month gets judged on feel.
Feel says the ads are not working. The math usually says something smaller, more specific, and a lot cheaper to fix.
You already have the four rates. They are sitting in your calendar, your CRM, and your closer's memory. Lead-to-call rate: of the people who become leads, how many book.
Qualified rate: of the bookings, how many are with someone who could actually buy. Show rate: of those, how many turn up. Close rate: of the shows, how many pay.
Four fractions. Your whole business lives inside them, and once they are on paper two things become possible that were not possible yesterday: you can work backward from the revenue you want to the leads you need, and you can see in one week which rate is leaking. Both are division.
That is the whole article.
Backward Math: from a number you cannot picture to one you can
Nobody has a map for $600,000. Your mind cannot hold it, so it files the goal under "someday" and goes back to answering email. So we are going to stop asking for $600,000 and ask for something smaller.
Start at the top. $600,000 for the year at $3,000 a deal is 200 deals, about 17 a month. Now divide backward through the four rates.
At a 30 percent close rate, 17 deals need 56 shows. At a 60 percent show rate, 56 shows need 93 booked calls. At a 20 percent lead-to-call rate, 93 bookings need 463 leads a month.
That is 15 leads a working day.
Fifteen a day is the number that matters, and it matters because it is checkable on Tuesday. The yearly goal is a wish. The daily lead count is either happening or it is not, and if it is not happening in week one, the year is already off track and you know it with eleven months left to act.
Most owners find out in December.
The same chain turns ad spend into a budget you can defend. Fifteen leads a day at a known cost per lead is your daily ad budget, the same back-solve we walk through for sizing a Google Ads budget. And it prices a lead: $600,000 across roughly 5,500 leads a year is about $108 of revenue per lead before costs.
Hold every lead source against that figure. A source delivering leads at $150 is losing you money even when the leads look good.
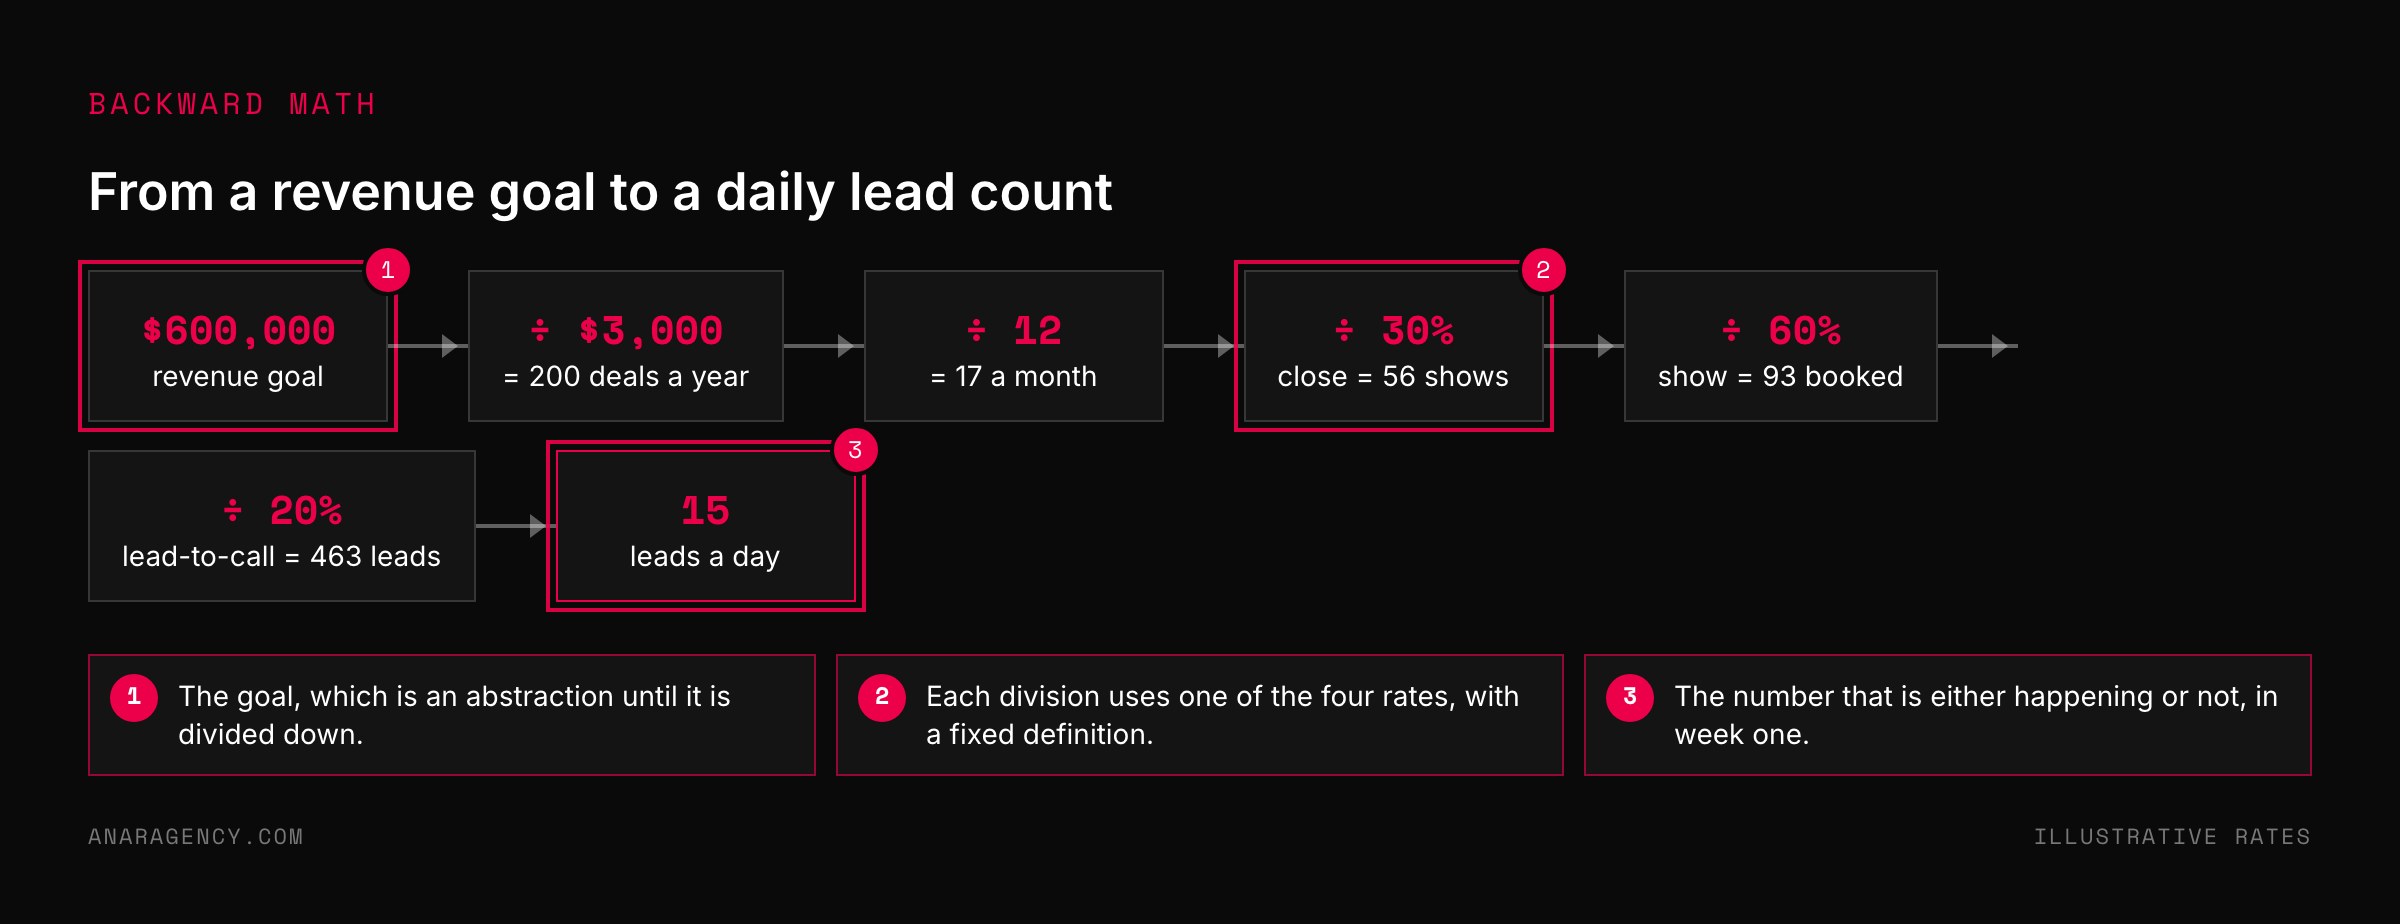
Write down four rates with fixed definitions: lead-to-call (booked divided by leads), qualified (qualified divided by booked), show (shows divided by qualified bookings), and close (deals divided by shows). Divide a yearly revenue goal by deal size, then backward through the four rates, then by 365, to get a daily lead target. Track all four weekly against a target; the one furthest off is the leak, and its layer, traffic, funnel, or sales, names the owner of the fix.
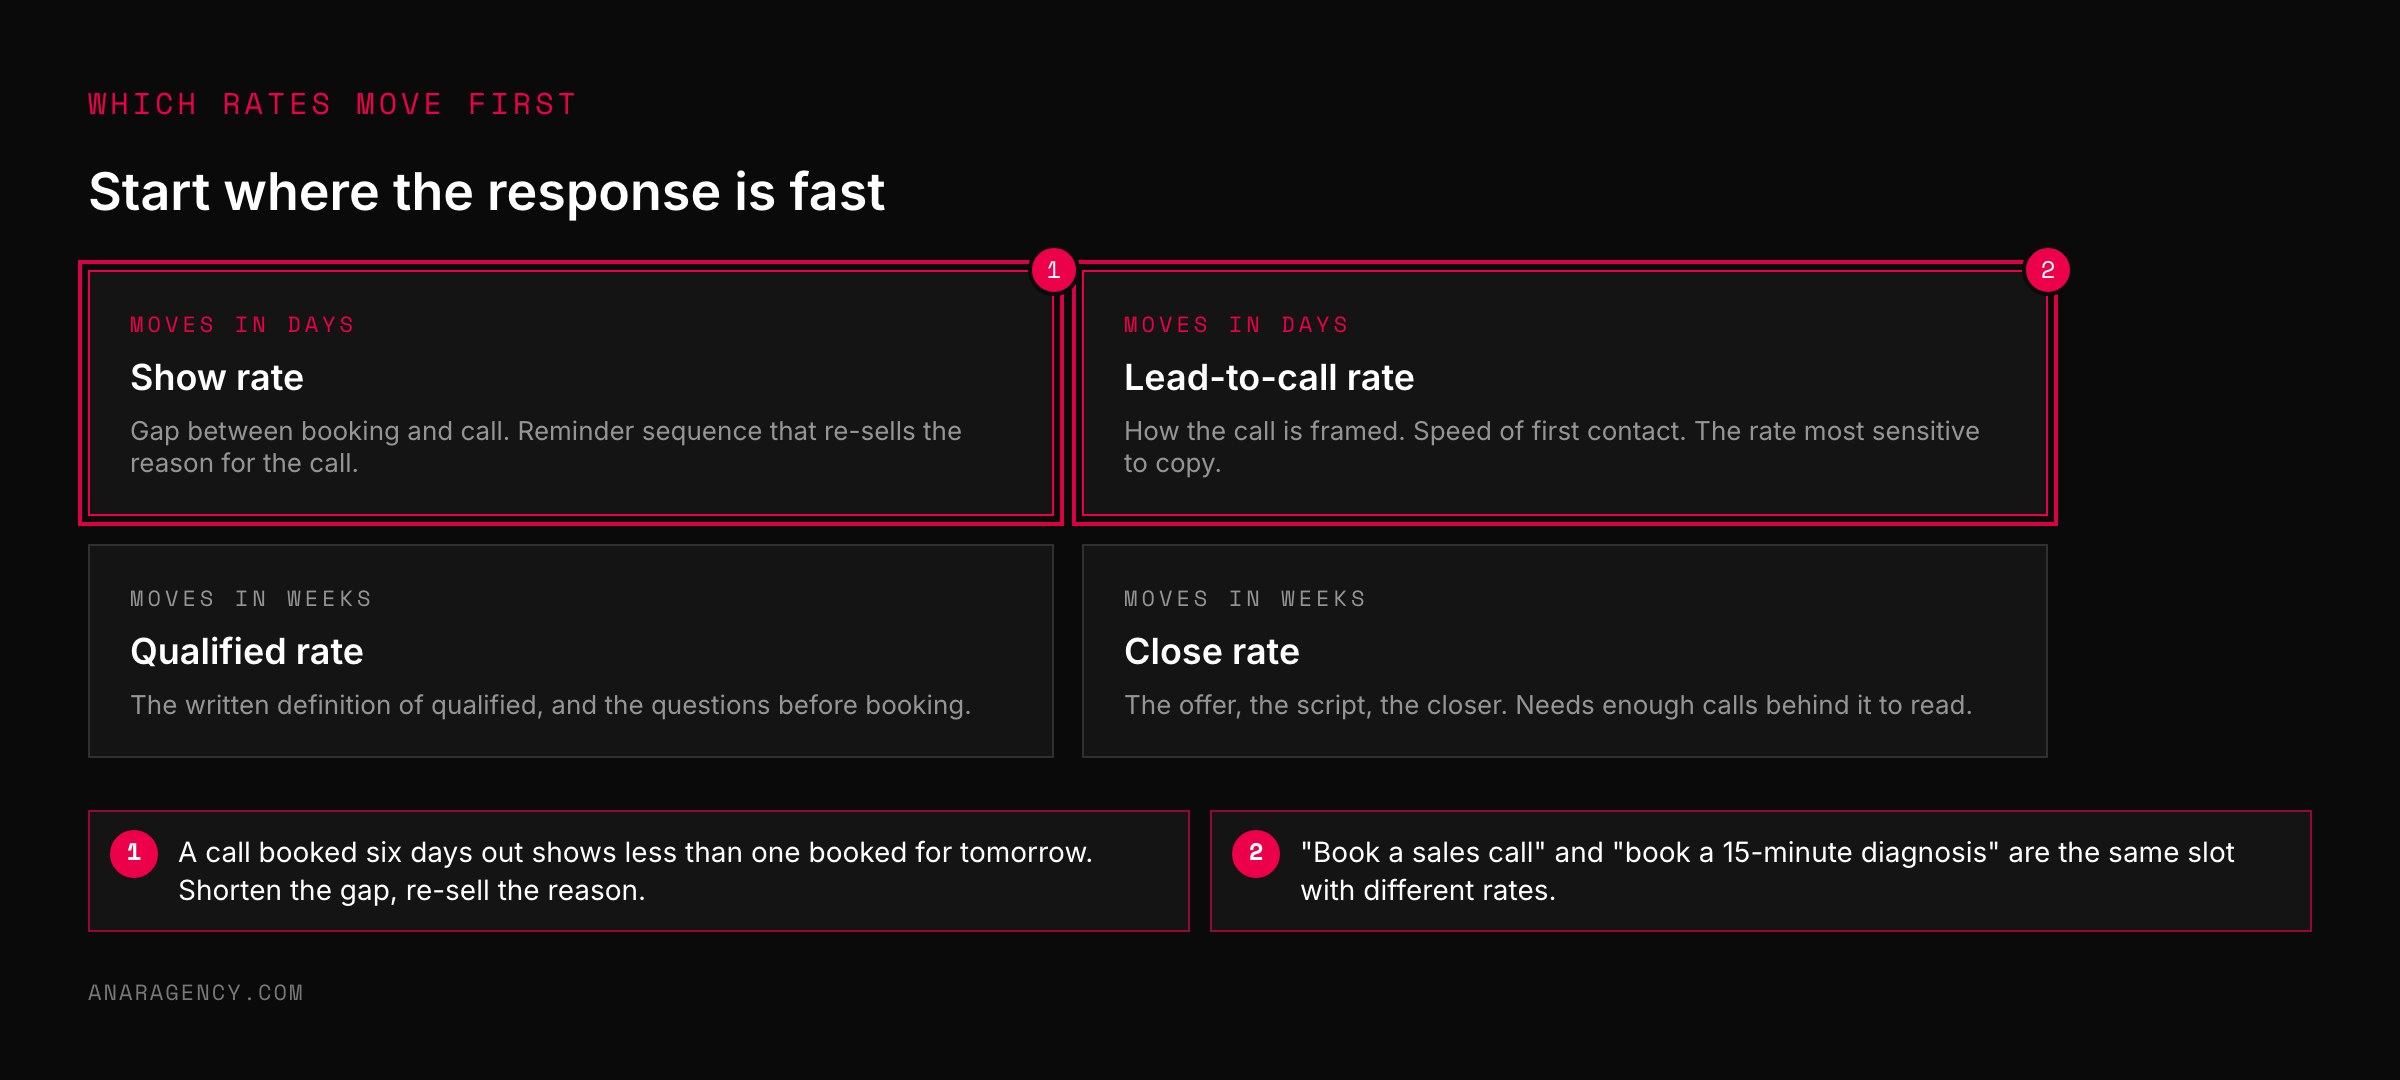
Fix show rate and lead-to-call first; they move in days.
The four rates, pinned down so nobody can argue with them
A rate computed two different ways in two different reports is not a rate. It is an argument waiting for a Monday meeting. So pin each one down once.
Lead-to-call rate is booked calls divided by leads in the same period. Qualified rate is qualified calls divided by booked calls, where "qualified" is a written definition, not a closer's opinion: a budget, a decision-maker, a problem your service solves.
Show rate is shows divided by qualified bookings. Close rate is closed deals divided by shows. Not divided by bookings, not divided by leads, divided by shows.
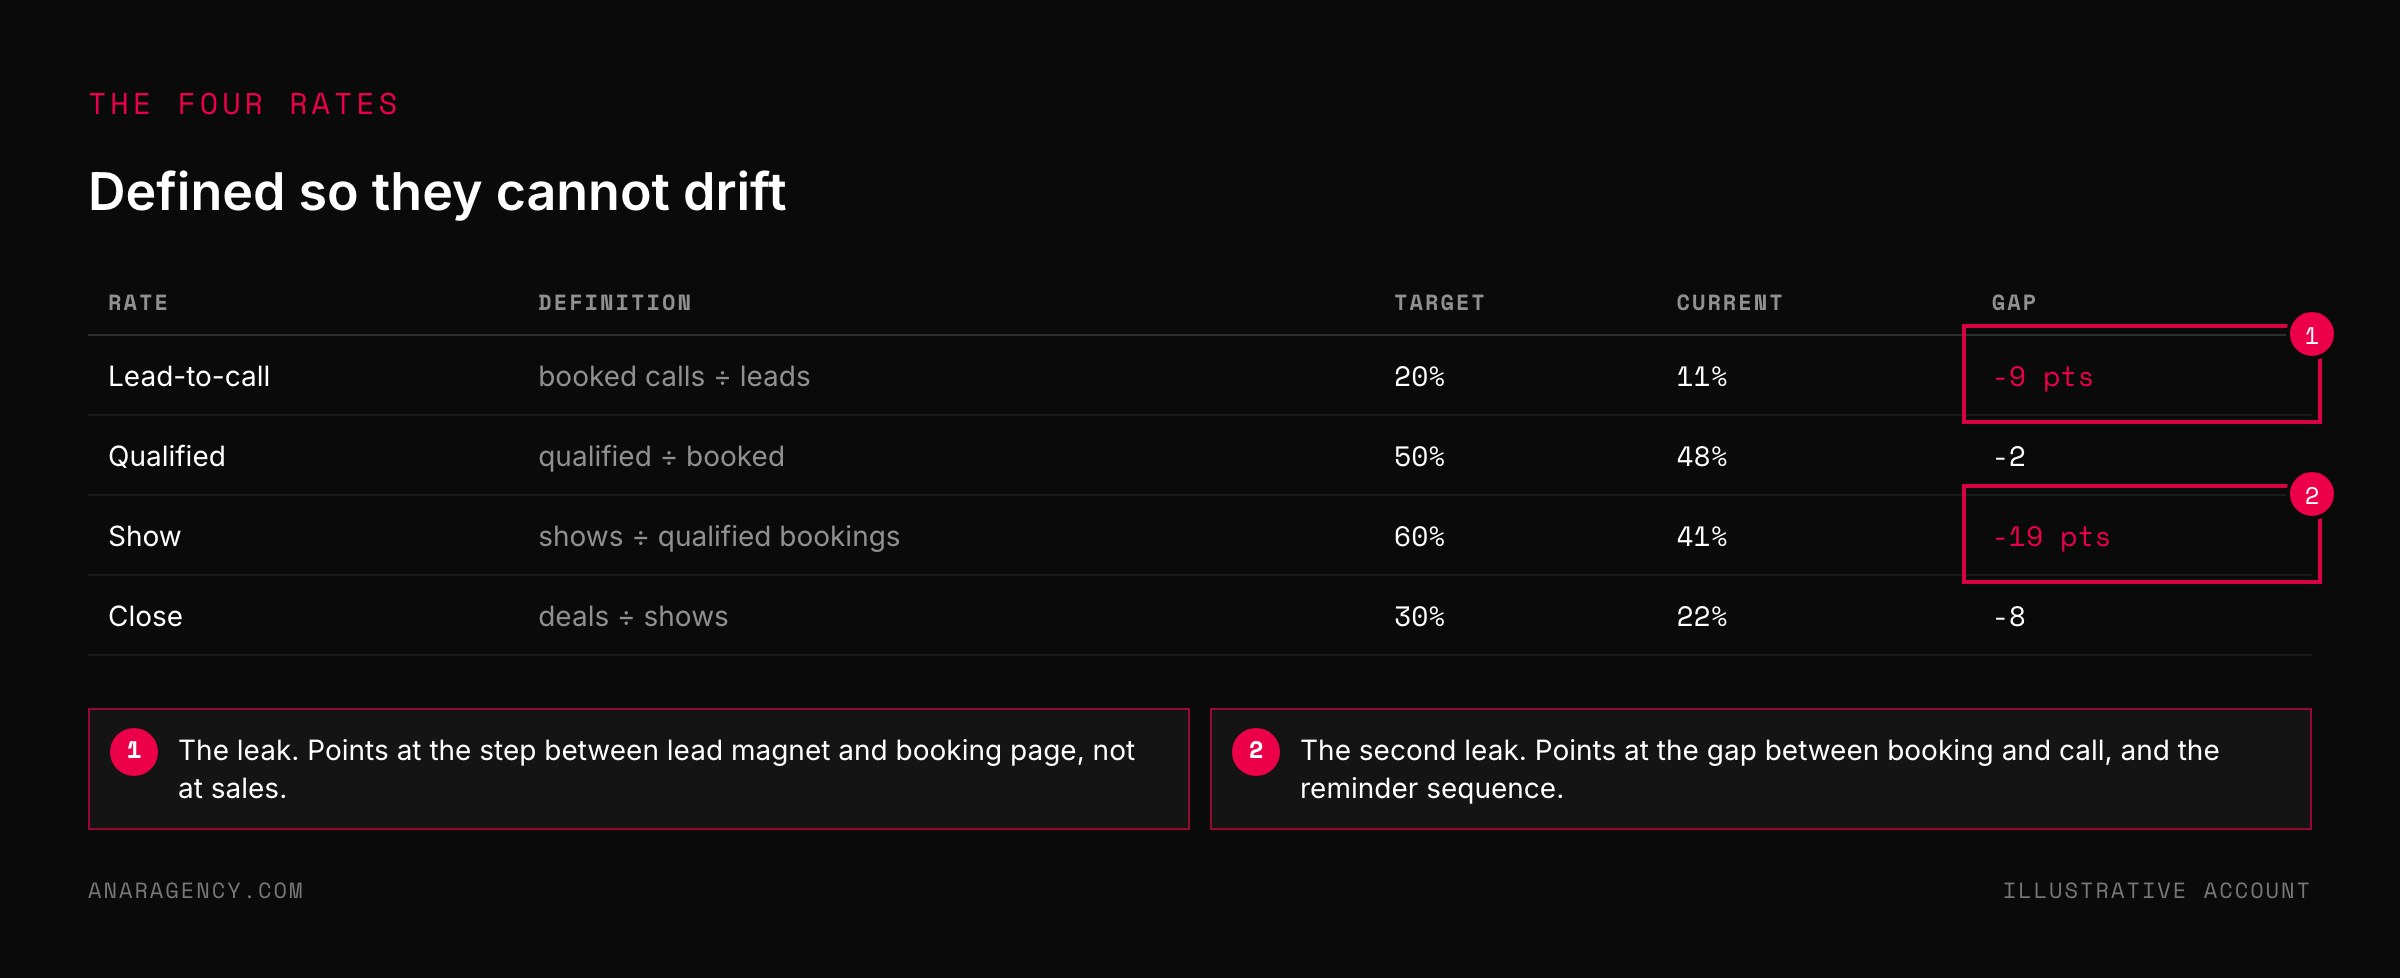
Each rate needs a target, and the target comes from one of two places: your own best month, or a goal you set against it on purpose. The targets in the figure above are illustrative. Your baseline comes from your live data, and the gap between target and baseline is the whole diagnosis.
In the example, three rates sit within a few points of target and the lead-to-call rate is at 11 percent against 20.
That is the leak. And it is not a sales problem.
A low lead-to-call rate means the step between your lead magnet and your booking page is failing. The lead did not want the call badly enough, or the call was framed as a sales call when it should have been framed as a diagnosis, or the booking flow lost them on the way. Of the four rates, this is the one most sensitive to words on a page, which makes it the cheapest to move.
Three layers: who owns the fix
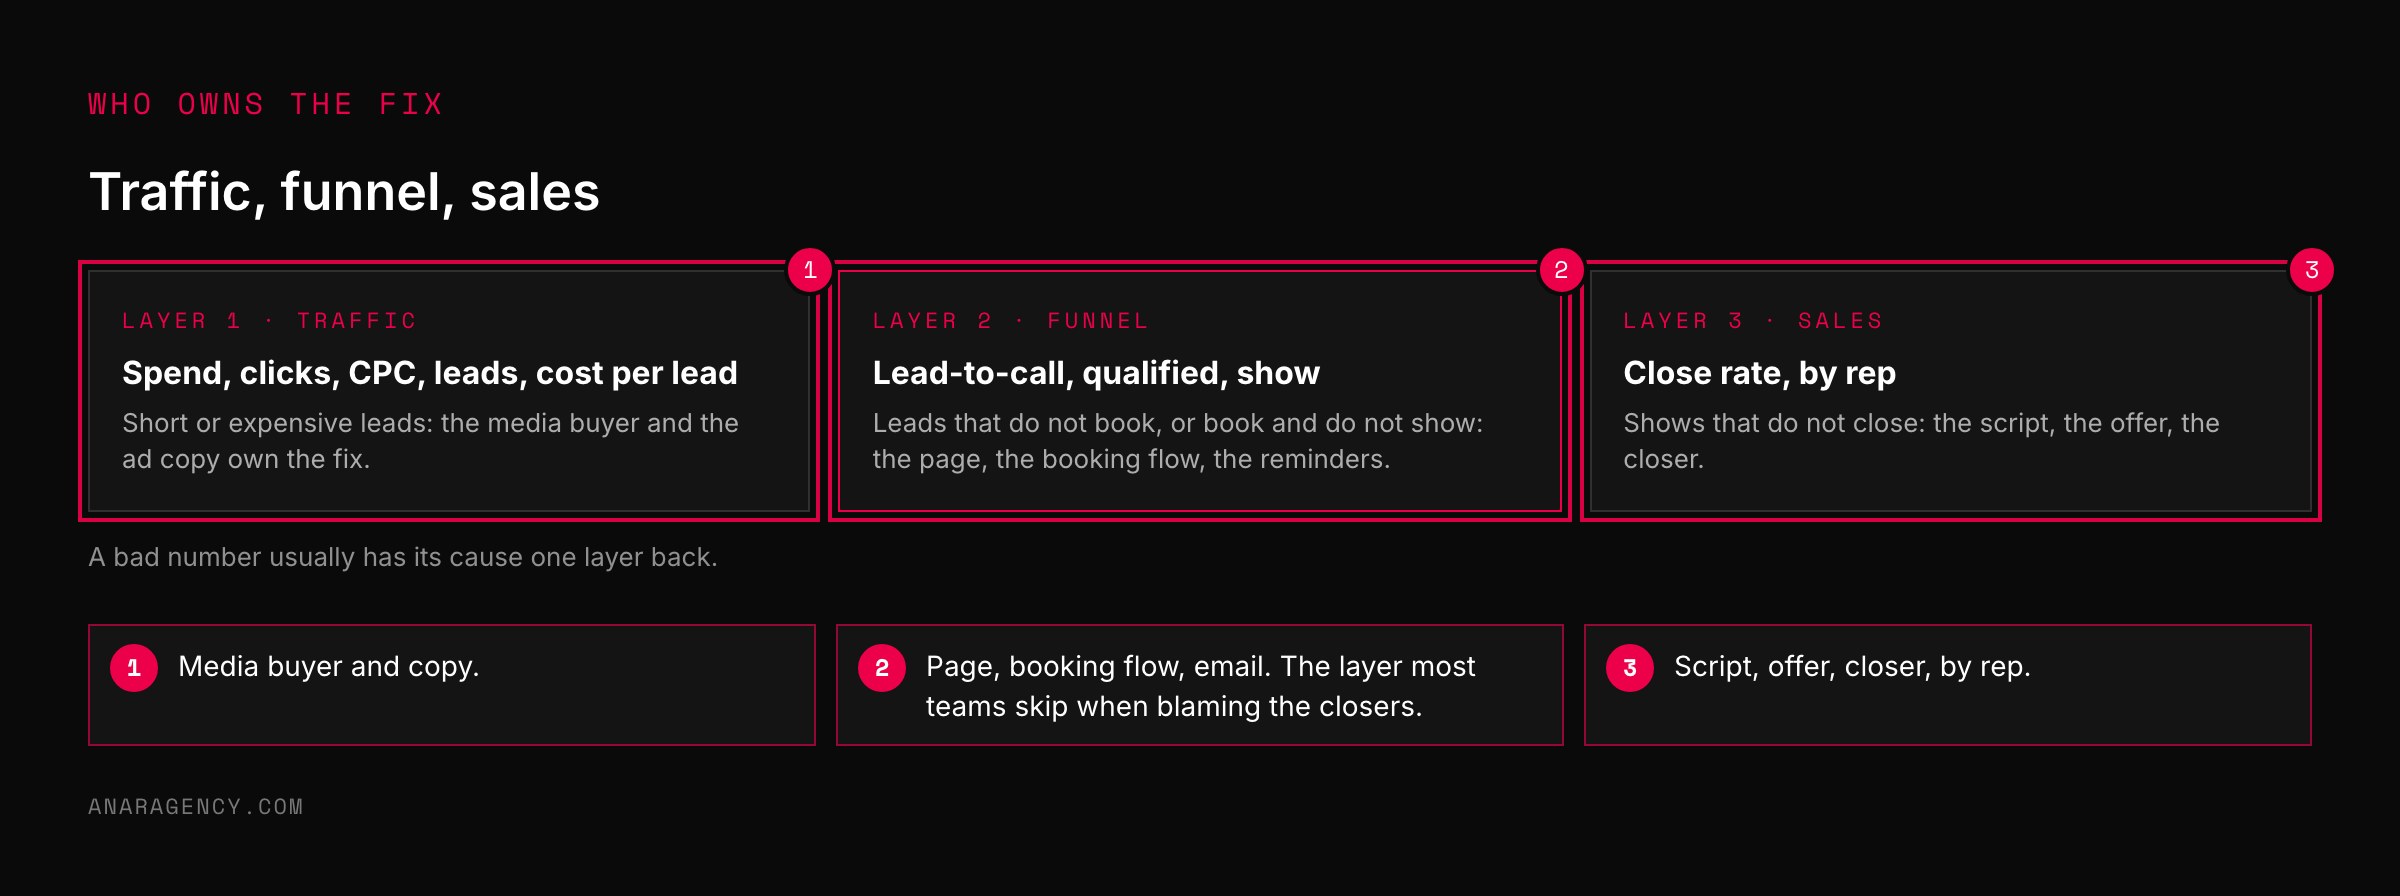
A book-a-call funnel has three layers, and every number you track lives in exactly one of them. Traffic: spend, clicks, cost per click, leads, cost per lead. Funnel: lead-to-call, qualified, and show rates.
Sales: close rate, by rep.
When a number is off target, the layer it sits in names the owner of the fix. That one rule stops the most expensive habit in these businesses: the owner blaming the closers for a problem that started in the ads.
Cause usually sits one layer back from the symptom. A low close rate on calls that were never qualified is a funnel problem. The closers are doing fine with people who could buy and badly with people who never could.
A low show rate on leads from a giveaway ad is a traffic problem: the ad promised something other than a conversation. Before you fix a number, look at the layer before it.
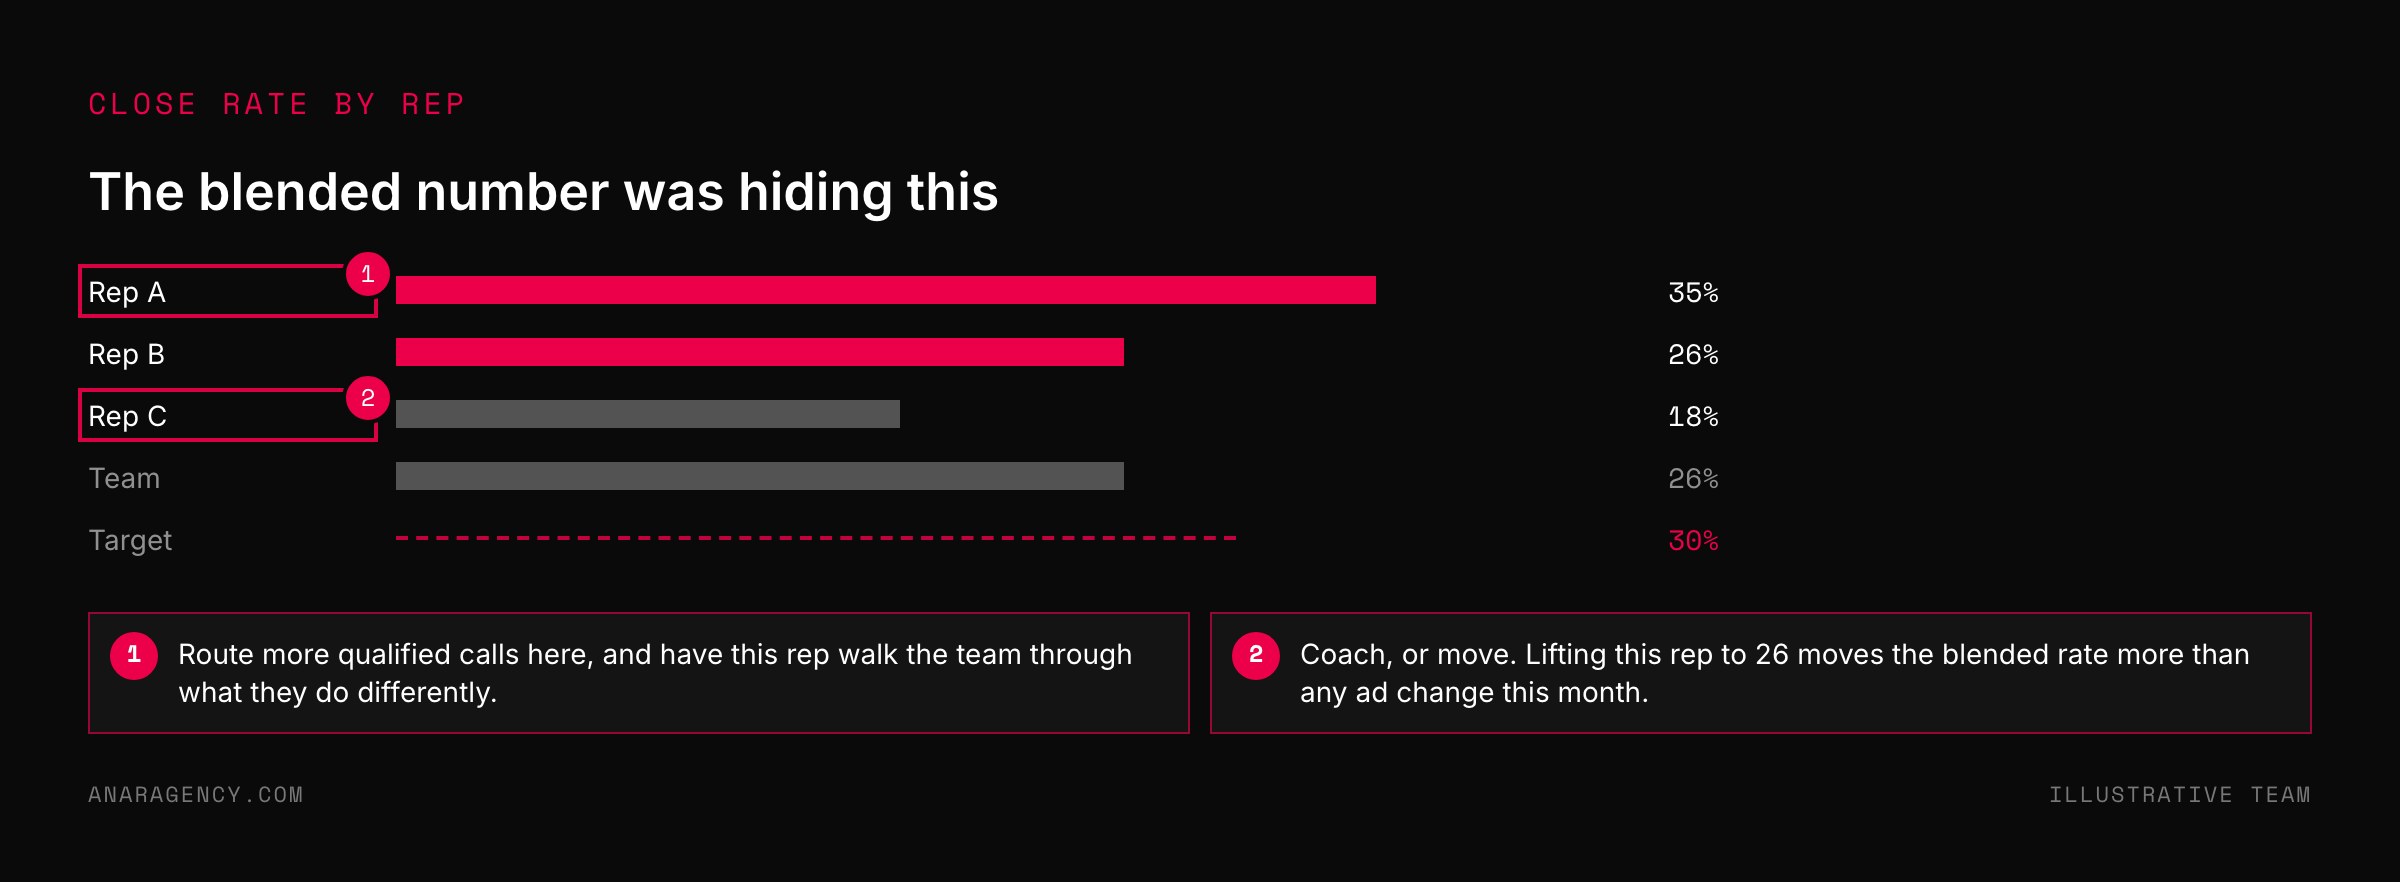
Inside the sales layer, break close rate out by rep, because a team at 26 percent against a 30 percent target is almost never a team at 26 percent. It is one closer at 35 and one at 18. Once you can see that, the three moves are obvious: route more qualified calls to the strong closer, have the strong closer show the room what they do differently, or coach the one at 18 up.
Moving one rep from 18 to 26 can move your blended rate more than any ad change that month.
The weekly scorecard: ten minutes that replace every "are the ads working" conversation
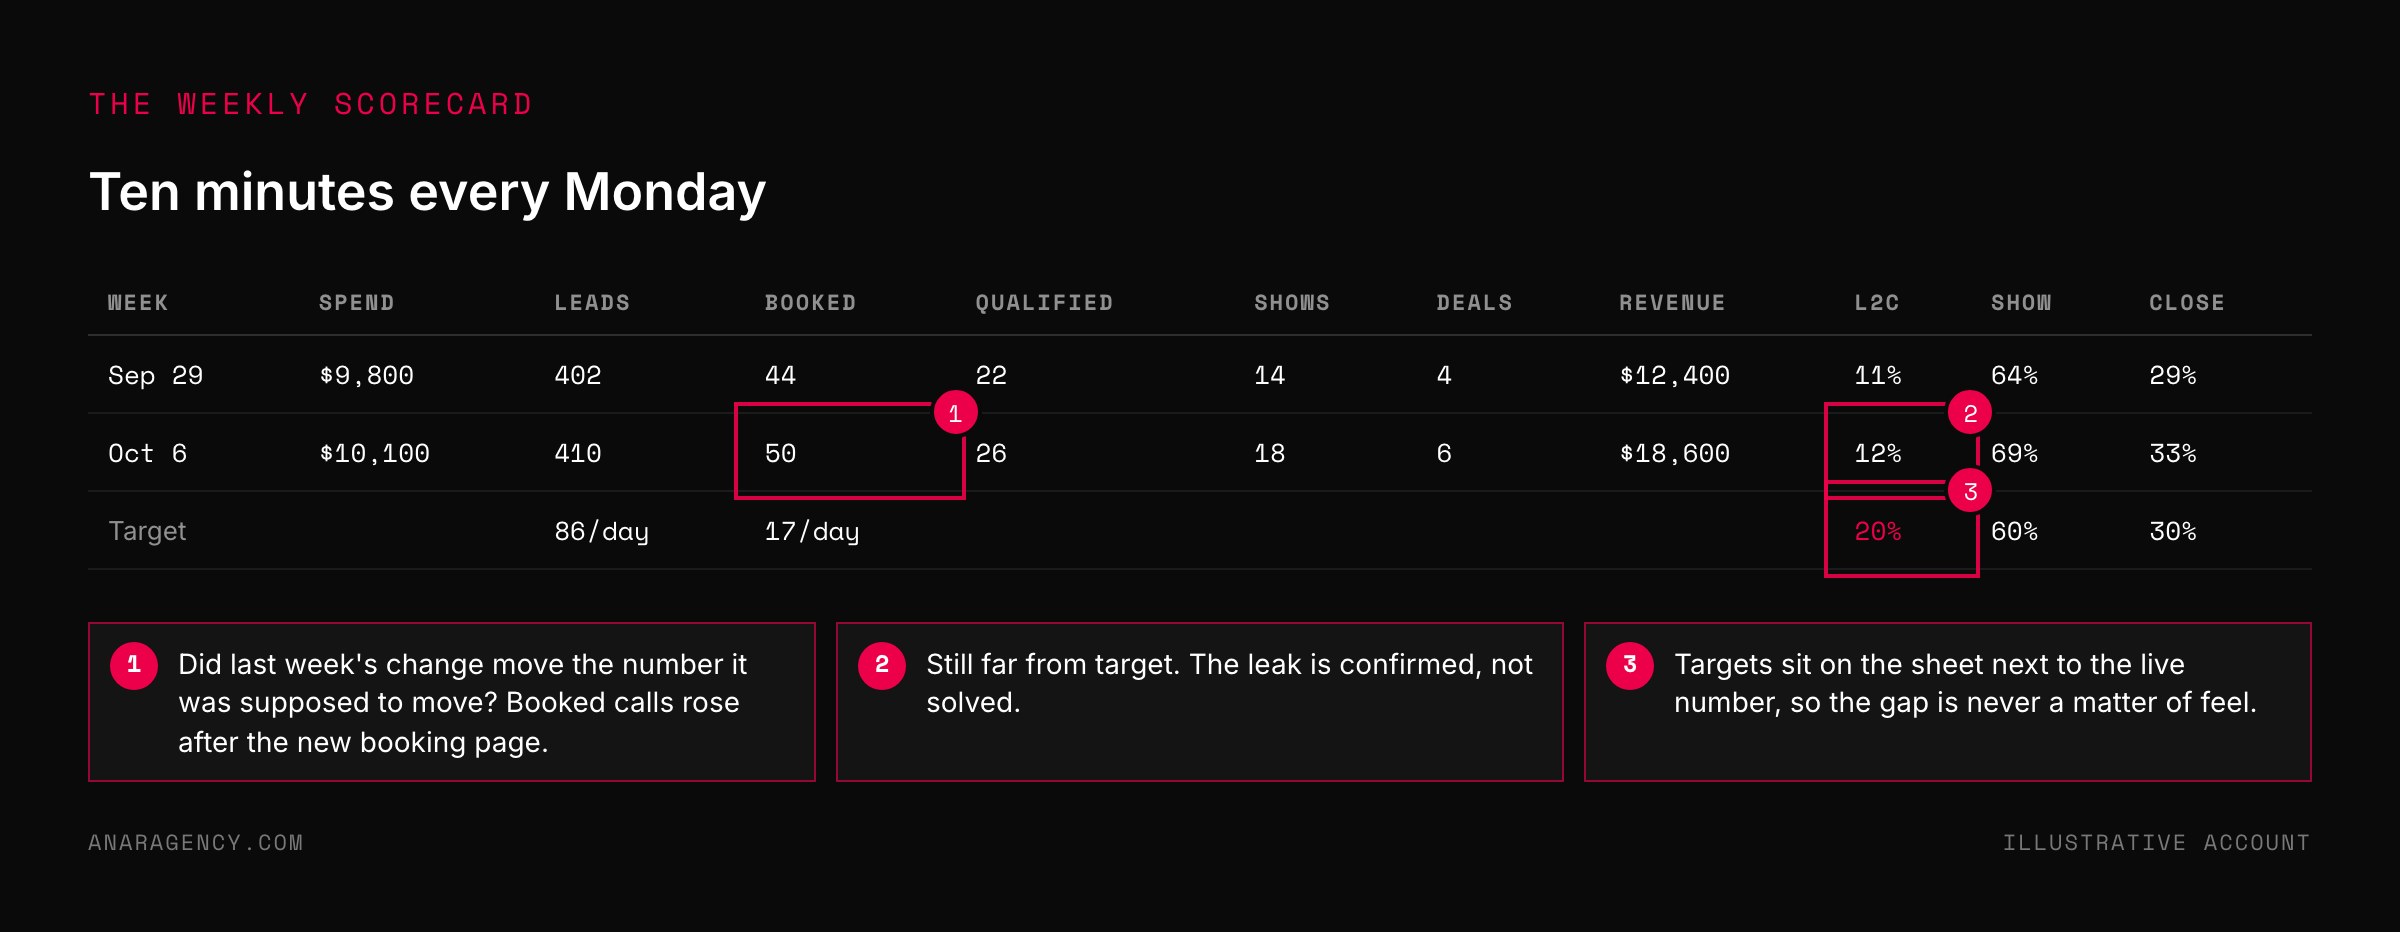
Everything above fits on one dated table. Raw inputs across the top: spend, clicks, leads, booked calls, qualified calls, shows, deals, revenue, average deal size. Computed underneath: cost per lead, the four rates, revenue per lead, and each rep's close rate.
Two more columns per row: the target, and on-track or off-track.
That table is your instrument panel. An owner who reads it every Monday never has to ask whether the ads are working, because the panel already said.
Two reads matter each week. First, which rates are below target and by how much. Second, did the thing you changed last week move the number it was supposed to move.
A new ad angle shows up in cost per lead. A new booking page shows up in lead-to-call. A reminder sequence shows up in show rate, and a script change shows up in close rate.
If the number did not move, the change did not work, no matter how it felt.
The scorecard only works on honest inputs, which means your booking tool and your ad platform have to agree on what a lead and a call are. Google's funnel exploration report shows the drop at each step once the steps are defined as events. Booked calls from Google Calendar appointment schedules or a tool like Calendly should fire one of those events, and closed deals should flow back to the ad platform through offline conversion import so the ads learn which leads became revenue.
Leads captured inside the platform through Meta lead ads or Google lead forms count as leads the moment they land. The clock on lead-to-call starts right then, not when someone opens the spreadsheet.
Start with the two rates that move this week
Show rate and lead-to-call rate respond within days, so when a funnel is underperforming, that is where you start. Show rate moves with the reminder sequence and with the gap between booking and call. A call booked six days out shows up less often than one booked for tomorrow, and a sequence that confirms, reminds, and re-sells the reason for the call across that gap can lift show rate by double digits.
A no-show is usually a lead whose reason for booking faded before the call arrived.
Lead-to-call rate moves with how the call is framed. "Book a sales call" and "book a 15-minute look at why your leads are not booking" are the same calendar slot with two different rates. Speed matters just as much: the Harvard Business Review's study of lead response found that the faster the first contact after a lead arrives, the more likely that lead is still interested when you reach them, and most firms were far slower than the window where that held.
A lead contacted in minutes books. A lead contacted tomorrow has moved on.
Close rate and qualified rate are slower. They move with the offer, the script, and the definition of a qualified lead, and each of those takes weeks of calls to read. So fix the fast two first, read the scorecard for a month, then take on the slow two with enough calls behind you to know what changed.
If the daily number is wrong in week one, you will know it. When the scorecard is on your desk every Monday, you will know which layer to look at. After the first month, you will know your own four rates better than any agency pitching you ever could, and that is the point.
Our article on the conversion-first audit covers the five minutes after a lead arrives, which is where the fast two rates are won or lost.
Questions executives ask
How many leads do I need to hit my revenue goal?
Divide the goal by your average deal size to get deals, then divide by close rate for shows, by show rate for booked calls, and by lead-to-call rate for leads. Divide by 365 for a daily target. A $600,000 goal at $3,000 a deal with a 30 percent close, 60 percent show, and 20 percent lead-to-call rate needs about 15 leads a day.
What is a good show rate for sales calls?
It depends on the gap between booking and call and on the reminder sequence, so set the target from your own best month rather than a published average. Shorter gaps and a sequence that re-sells the reason for the call both raise it, and it is one of the two rates that respond within days.
Why is my close rate low?
Check the layer before it first. If the calls were not qualified, the close rate is a funnel problem, not a sales problem. If they were qualified and still did not close, break the rate out by rep; a blended number usually hides one strong closer and one weak one.
What should be on a weekly sales scorecard?
Raw inputs: spend, clicks, leads, booked calls, qualified calls, shows, deals, revenue, average deal size. Computed: cost per lead, the four rates, revenue per lead, close rate by rep. Each with a target and an on-track flag.
Read it every Monday for target gaps and week-over-week change.
What is lead-to-call rate and why does it matter?
Booked calls divided by leads. It measures whether the step between becoming a lead and booking a call is working, which is mostly a question of how the call is framed and how fast the first contact happens. It is the rate most sensitive to copy, which makes it the cheapest to improve.

Filip Kovacevic is the founder of Anar Agency in Phoenix. He spent five years running SEO, Meta ads, email, and content for medical practices across the United States, and now does the same work for healthcare, home-service, legal, and professional-service businesses, alongside AI implementation. More from Filip →
Talk it through in 15 minutes
Bring one AI question from this article. We will tell you what we would do, whether or not you hire us.
Book a 15-Min Chat →