Read 'Results', Not 'Leads': The Meta Reporting Mistake That Hides Winners

When judging Meta ads, read each ad set's own Results column, not a generic Leads column. Results counts whatever outcome that ad set was set up to produce, which may be a booked appointment or a custom event that never appears under Leads. Then segment before concluding anything: last 30 days instead of all time, each ad set separately, week by week, and ad by ad.
A blended account average can make a healthy campaign look like a failure, because it mixes old and new, strong and weak. The segmented read usually tells a different story.
The admissions puzzle
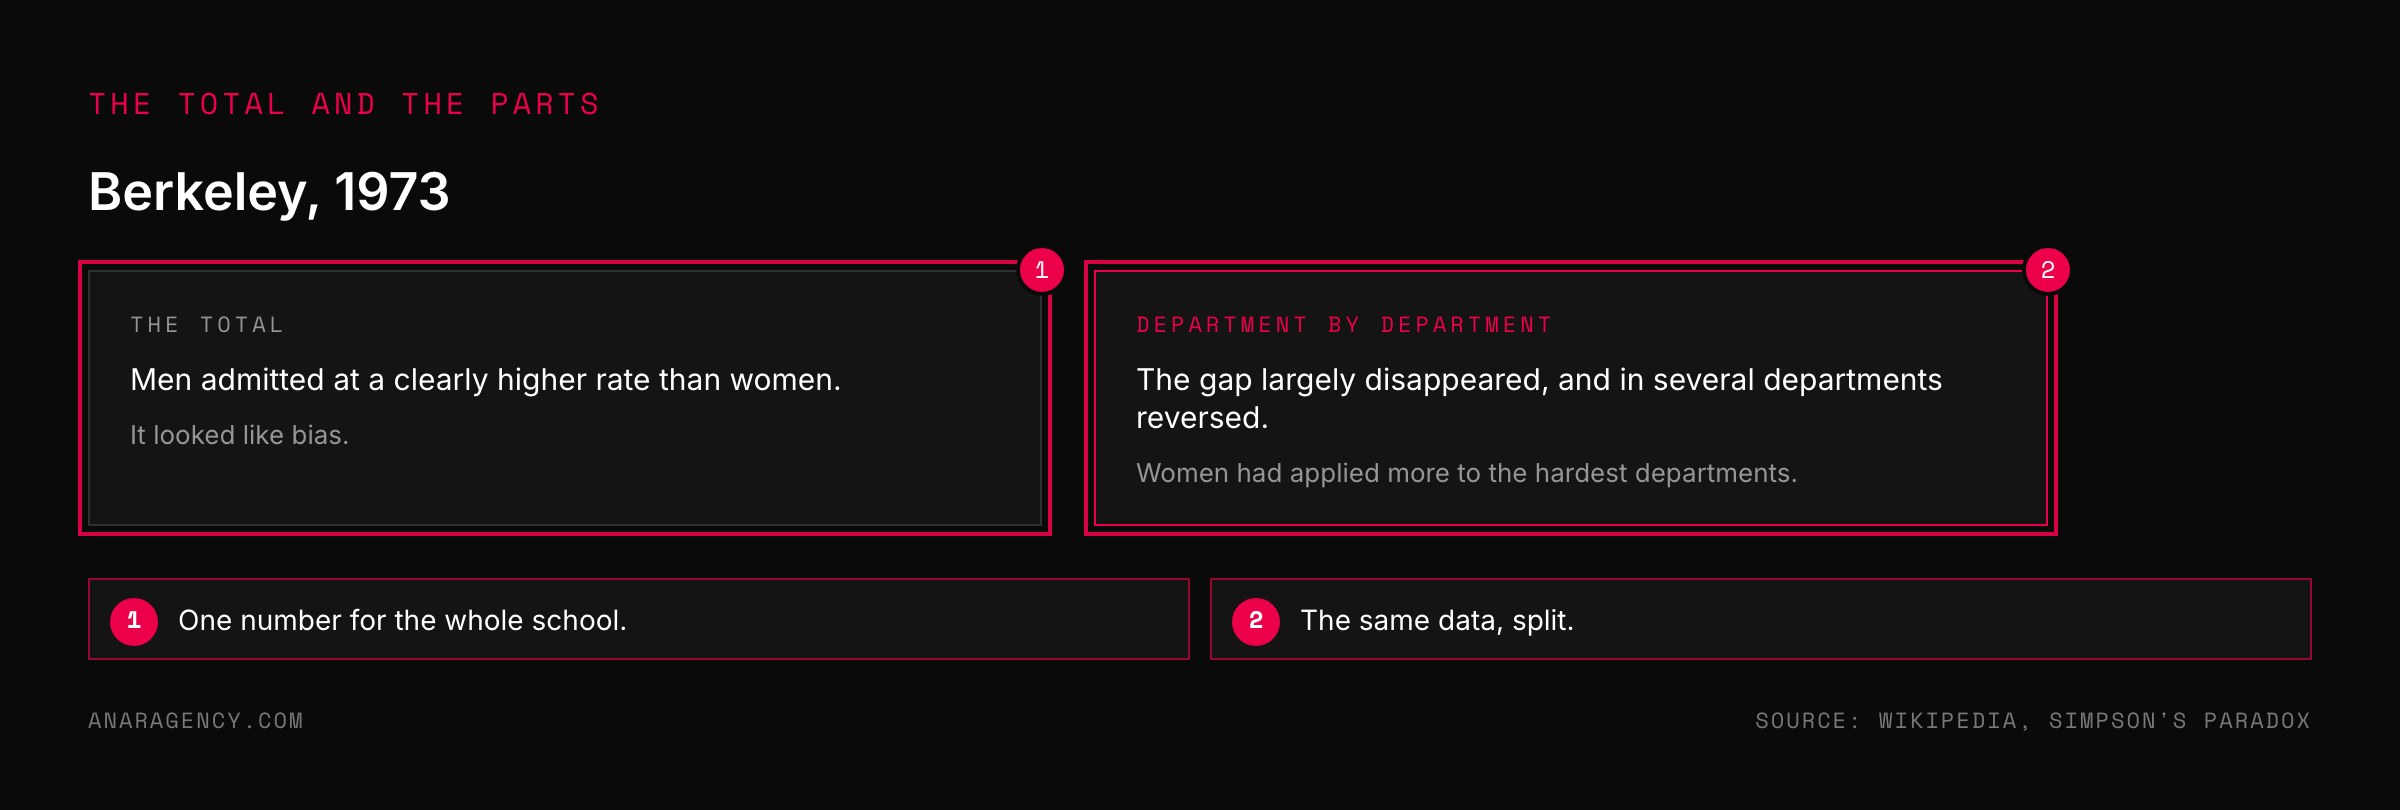
In the autumn of 1973 the graduate school at the University of California, Berkeley looked at its admissions figures and saw a problem.
Men who applied were more likely to be admitted than women, by a margin too large to be chance. It looked like plain bias.
Then researchers examined the figures department by department. The bias largely disappeared. In several departments women were admitted at a higher rate than men.
The explanation was in where people applied. Women had applied in greater numbers to departments that were hard for anyone to get into.
The total told one story and the parts told another. Statisticians call this Simpson's paradox, and it is sitting in most advertising accounts.
The column that lies by omission
Open a Meta ads account and there is a column called Leads. It seems like the obvious thing to read.
The trouble is that Leads counts one specific kind of event. Many campaigns are not set up to produce that event.
A campaign may be optimized for a booked appointment, a completed application, or a custom event the business defined. Those outcomes do not show up under Leads.
The right column is Results. Meta defines it as the number of times your ad achieved an outcome, based on the objective and settings you selected.
So Results means something different for each ad set, and that is the point. It reports what that ad set was asked to do.
Read the Leads column on an ad set optimized for booked consultations and it can show a handful of leads at hundreds of dollars each. Read Results on the same ad set and the cost is a small fraction of that.
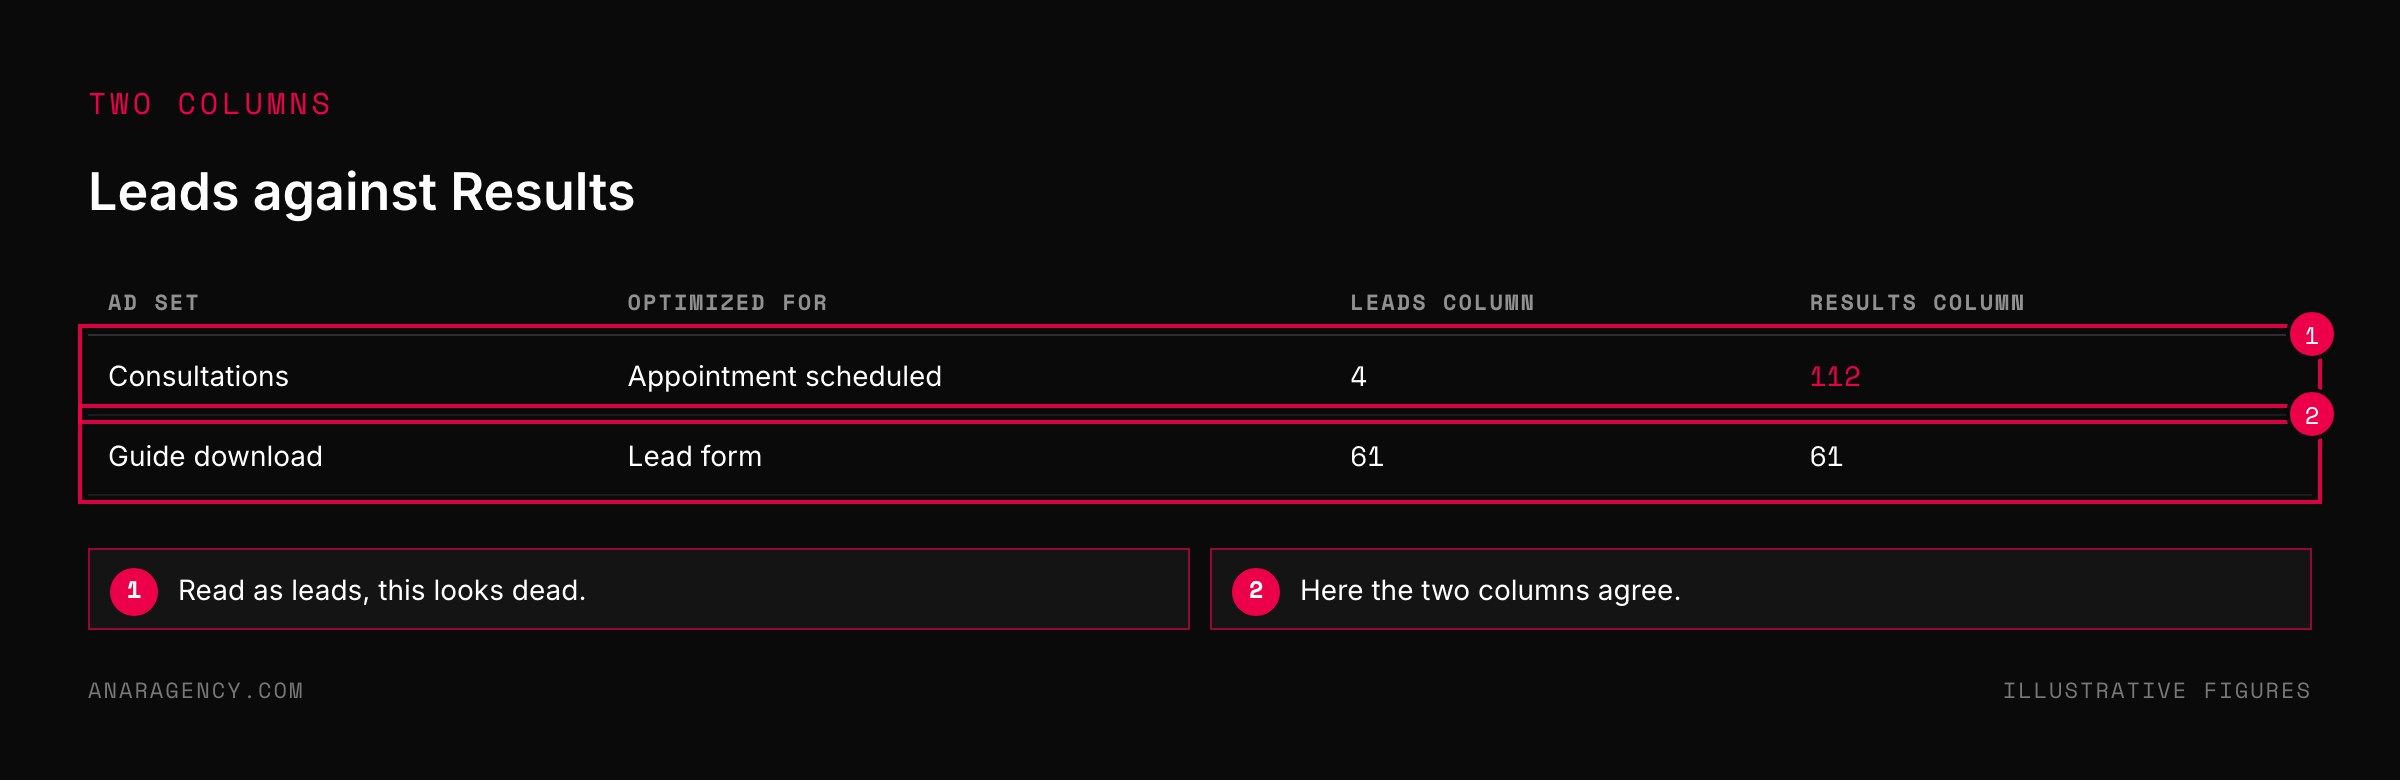
Never judge a Meta account on a blended total or on the Leads column alone. Make five cuts in order: which event each ad set is optimized for, the last 30 days of what is live, results and cost per result by ad set, the main ad set by week, and the best ad set by ad. State every number with its event, window, and segment.
Decide the cuts before looking and report weak segments too. Then check outside the platform how many results became conversations and customers.
Why the average misleads
The second trap is the blended number, and it is the Berkeley problem exactly.
An account holds old campaigns and new ones, tests that failed and ads that are working now. An all-time average stirs them together.
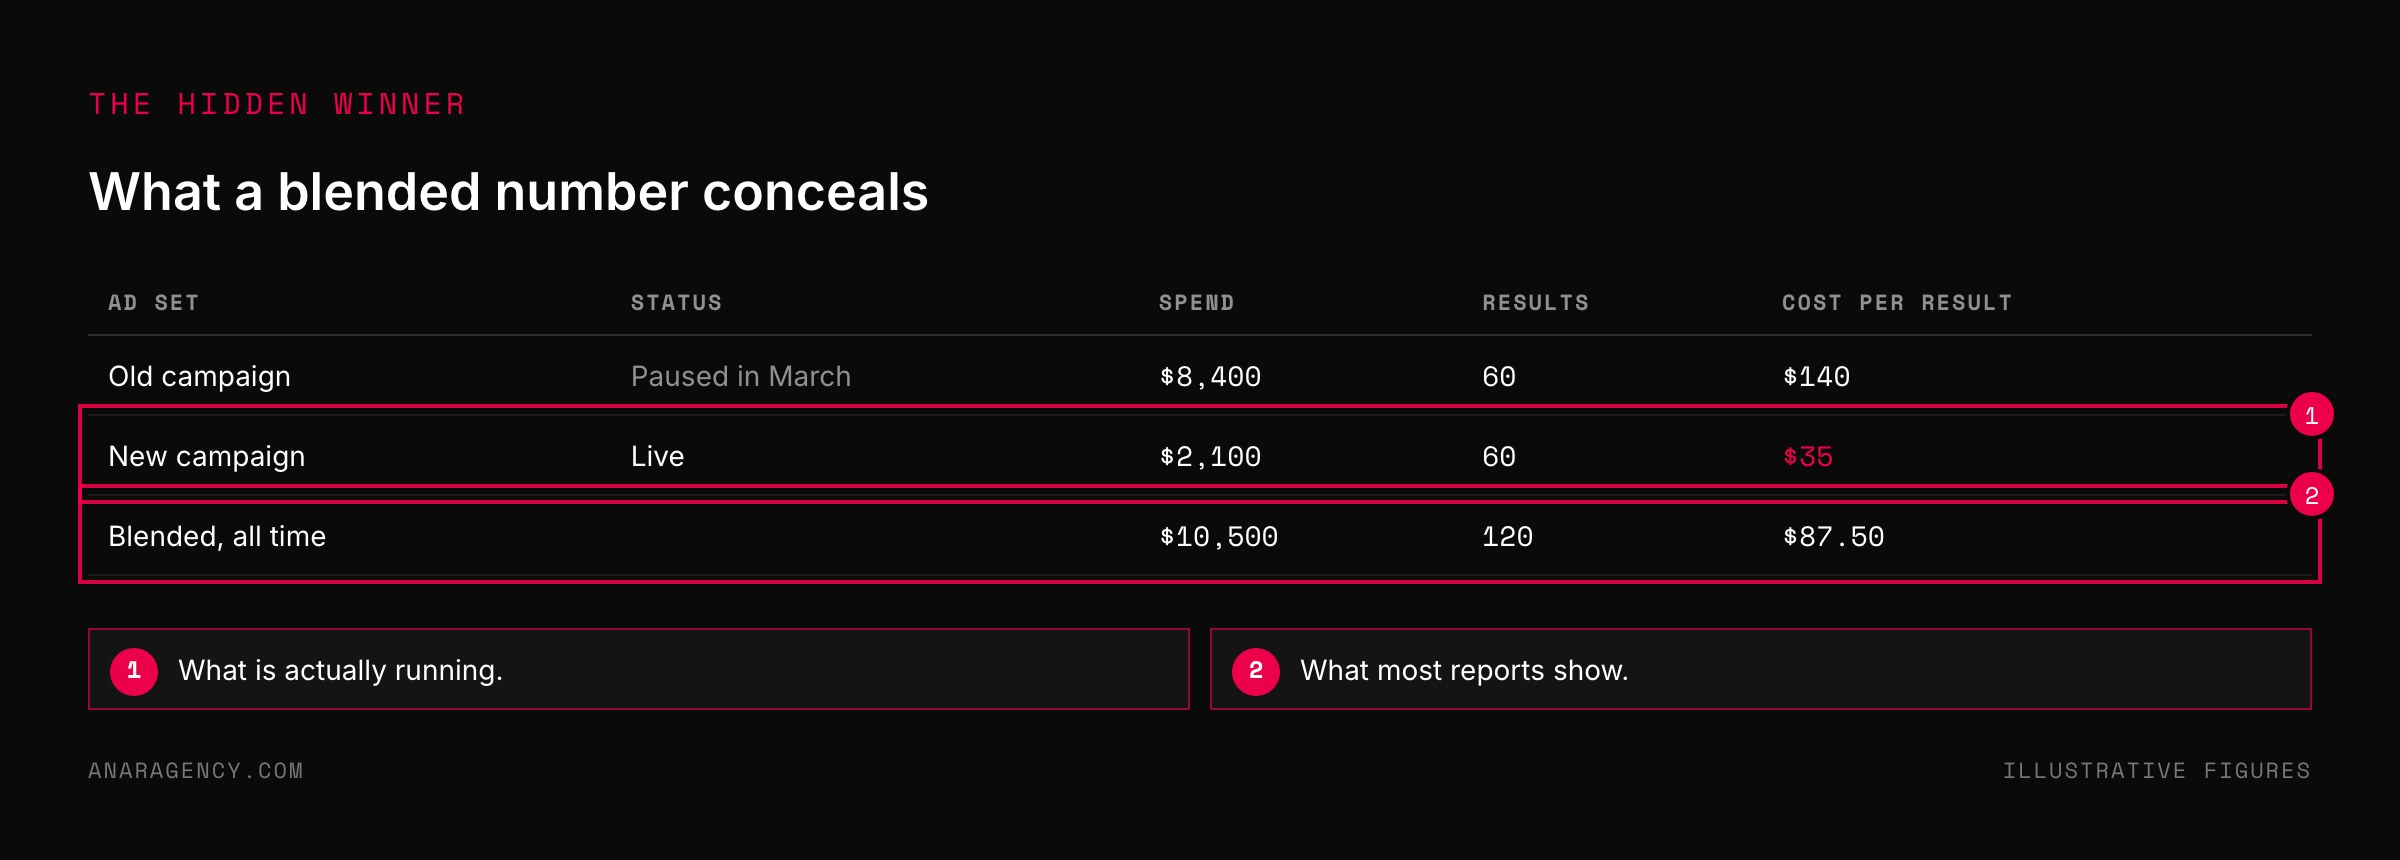
Suppose a new ad set is bringing leads at $35 and an old, paused one brought them at $140. Blended over the life of the account, the figure might be $90.
Someone reading $90 concludes the ads are too expensive and turns them off. They have just switched off the $35 ad set.
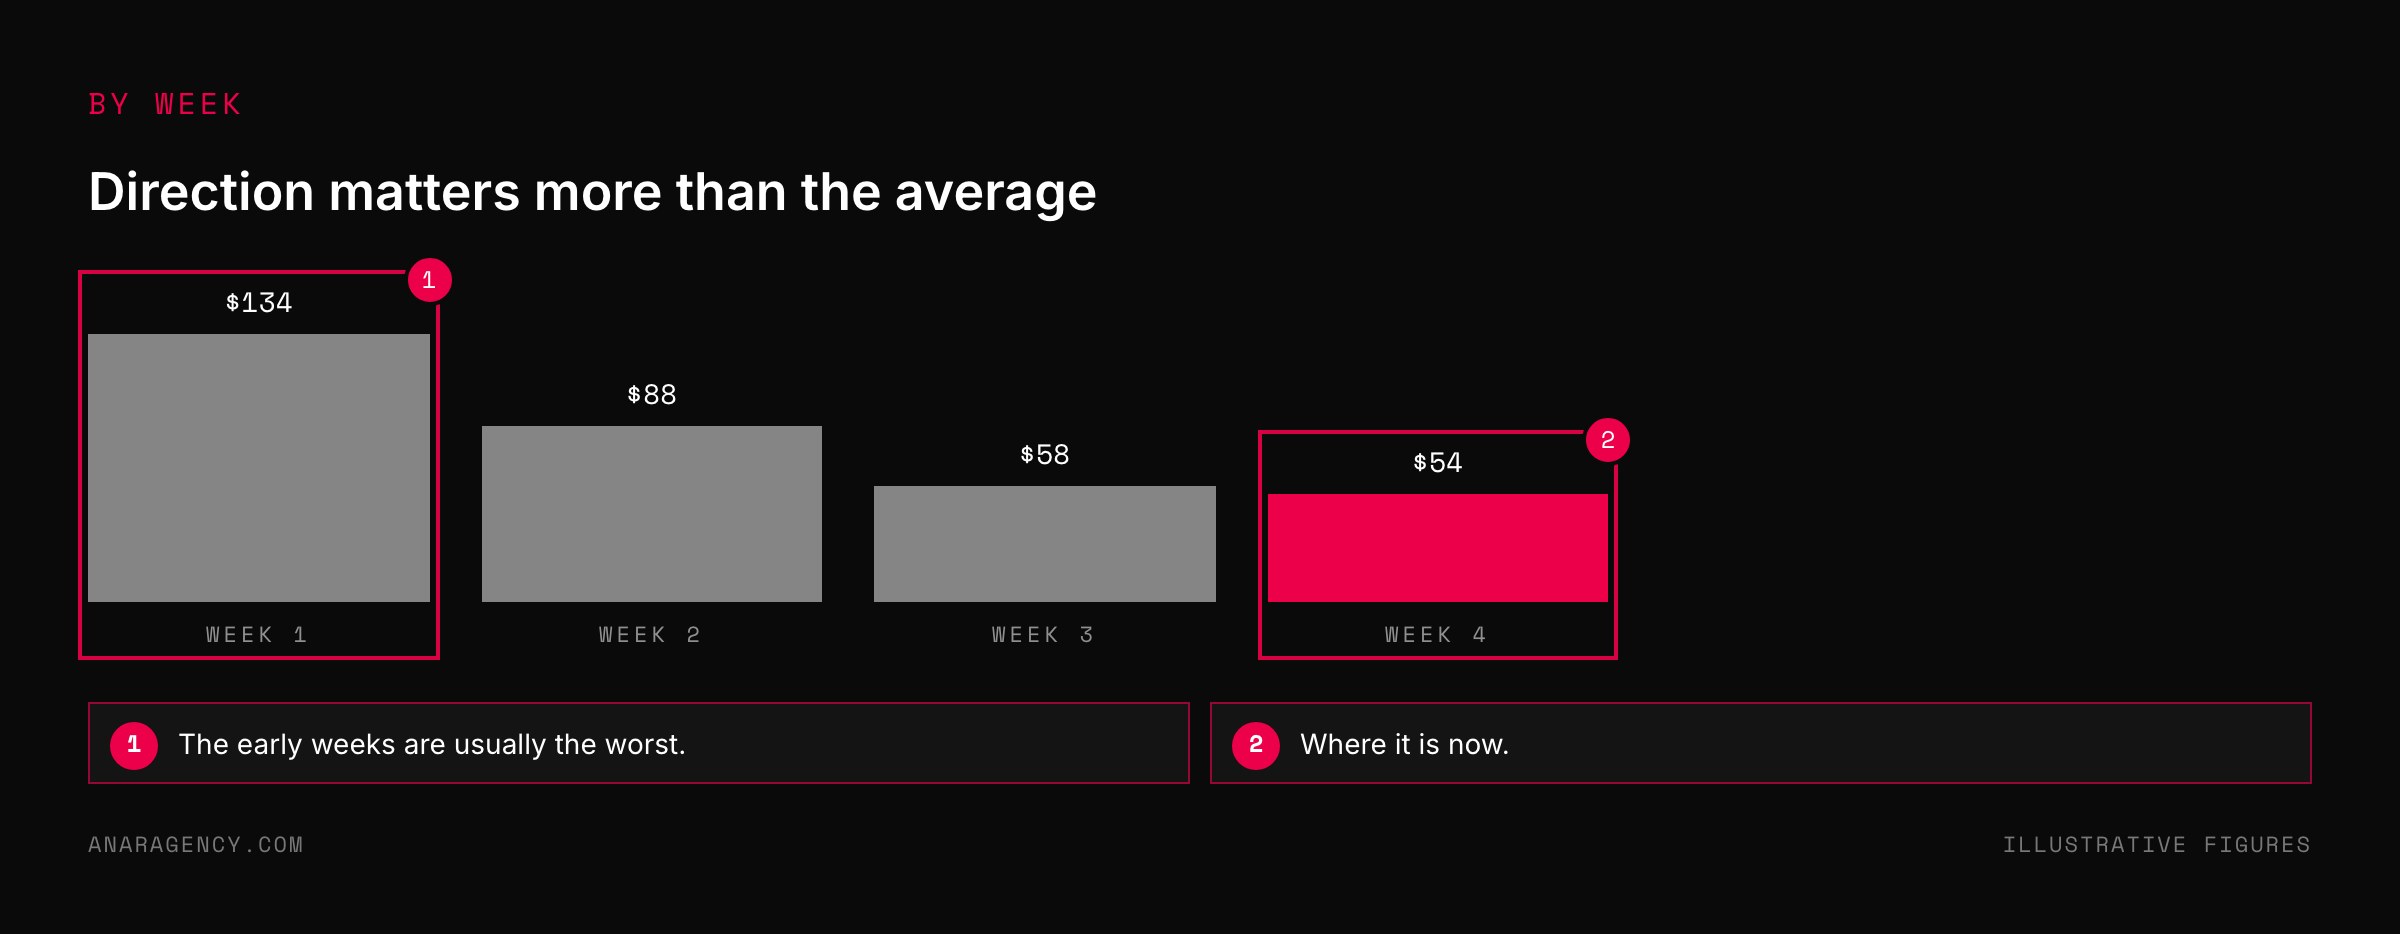
Time matters as well. A campaign's first weeks are usually its worst, while the platform is still learning who responds. A figure that includes those weeks understates where it is now.
And a single week proves little in either direction. An unusually good or bad week tends to be followed by a more ordinary one, the effect known as regression toward the mean.
Segment Readers: five cuts before a verdict
The people who make good calls on ad accounts are not better at arithmetic. They refuse to judge a total. We call them Segment Readers.
1. Which event? For each ad set, find what it is optimized for.
That is what its Results column is counting. Write it down.
2. Which window? The last 30 days of what is live.
Not all time, and not a range that includes a campaign you stopped months ago.
3. By ad set. Results and cost per result for each, side by side.
This is where a winner hiding in the average shows itself.
4. By week. Four weekly figures for the main ad set.
Falling cost means it is improving. Rising cost means something is wearing out.
5. By ad. Inside the best ad set, which single ad is carrying it?
That is the one to learn from, as we describe in copy the rules, not the ad.
Only after those five does anyone state a number. And the number is stated with its label: this event, this window, this ad set.
"My agency just sends me the total"
If the report you receive is one line with one cost per lead, you cannot tell whether your ads are working. Neither, on that evidence, can whoever sent it.
Ask three questions. Which event is being counted as a result? What date range is this?
And what does it look like split by ad set and by week?
A competent manager can answer all three in a few minutes. If they cannot, that tells you something.
Be careful in the other direction too. Segmenting is not a licence to hunt for the one slice that flatters. Decide the cuts before you look, and report the weak ad sets alongside the strong.
And remember what Results does not tell you. It counts the event, not its quality. Fifty cheap leads that never answer the phone are worse than ten that book.
So the last step is always outside the ad platform: how many results became conversations and how many became customers. Which number in the chain is broken is the subject of reading ad data.
What to read next, and why
Simpson's paradox (encyclopedia entry): The Berkeley case and other examples of totals that reverse when split.
Results (Meta Business Help Center): The platform's own definition of the column, and why it varies by objective.
About A/B testing (Meta Business Help Center): How to compare two things fairly once you know what to compare.
Regression toward the mean (encyclopedia entry): Why one extreme week should not drive a decision.
So the simple takeaway is this: before your next ads meeting, write beside every number which event it counts and which dates it covers. If you cannot, you are not ready to decide.
Questions executives ask
What does Results mean in Meta Ads Manager?
Meta defines Results as the number of times your ad achieved an outcome, based on the objective and settings you selected. It therefore counts different things for different ad sets, such as leads, booked appointments, or purchases.
Why does my Meta account show few leads when the ads seem to be working?
The Leads column counts one specific event. If a campaign is optimized for a different outcome, such as a scheduled appointment or a custom event, those outcomes appear under Results and not under Leads.
How should I analyze Meta ads performance?
Identify the event each ad set is optimized for, look at the last 30 days of live campaigns, compare results and cost per result by ad set, check the weekly trend, and find which individual ad drives the best ad set.
What is wrong with a blended cost per lead?
It averages old and new campaigns, failed tests and current winners. A strong ad set can be hidden inside a poor average, and acting on the average can mean switching off what works.
What should I ask my ad agency about their reports?
Ask which event is being counted as a result, what date range the figures cover, and what the numbers look like split by ad set and by week. Then ask how many of those results became conversations and customers.

Filip Kovacevic is the founder of Anar Agency in Phoenix. He spent five years running SEO, Meta ads, email, and content for medical practices across the United States, and now does the same work for healthcare, home-service, legal, and professional-service businesses, alongside AI implementation. More from Filip →
Talk it through in 15 minutes
Bring one AI question from this article. We will tell you what we would do, whether or not you hire us.
Book a 15-Min Chat →