Earnings Per Session Beats Conversion Rate
Earnings per session is revenue divided by visits, which is the same as conversion rate multiplied by average order value. It beats conversion rate as the number to judge a page by, because conversion rate only counts how many people bought and ignores how much they spent. A discount can lift conversion rate from 3.0 to 3.6 percent and still cut revenue per visitor.
Judge every test on earnings per session, compare it with what a click costs you, and do not call a test early.
The test that won and lost money
A store runs a test. Version A is the page as it stands. Version B adds a 25 percent discount banner.
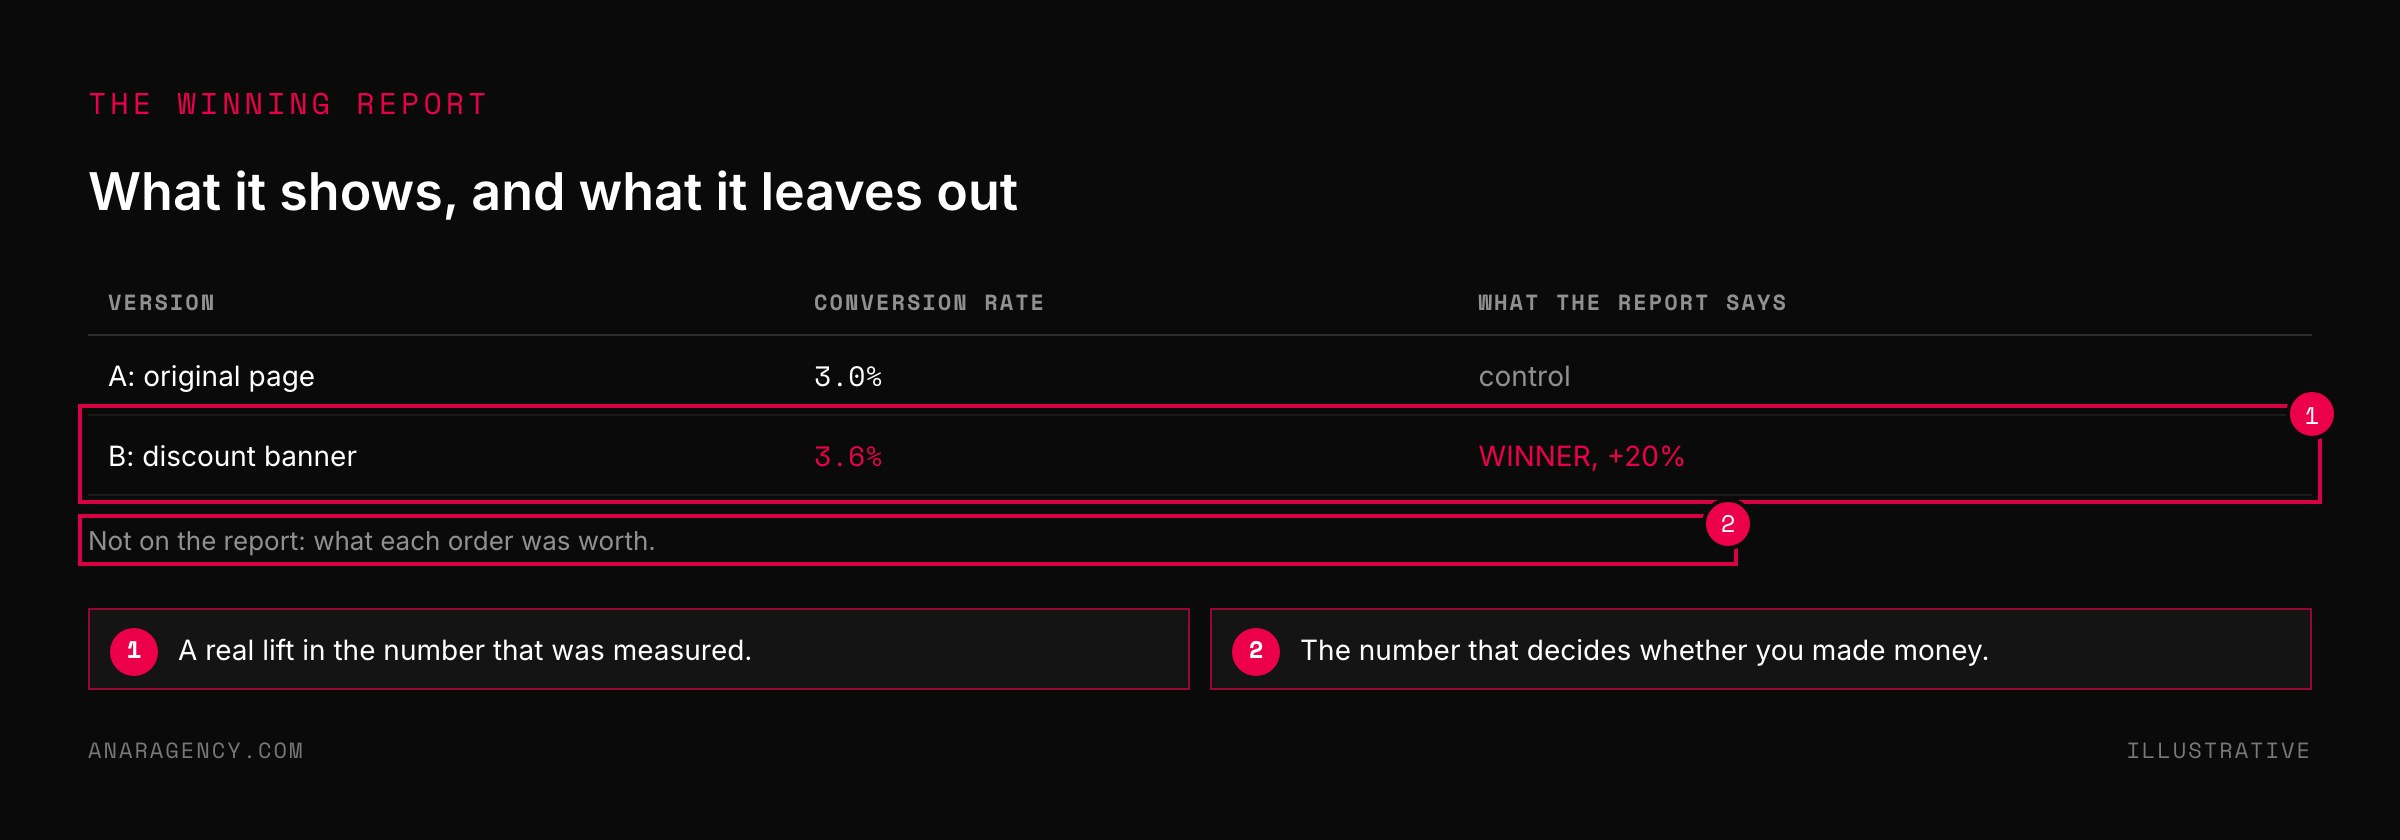
Two weeks later the report comes back. Version B converted at 3.6 percent against 3.0 for the original. A 20 percent lift.
Somebody posts it in the team chat with a trophy next to it.
The discount goes live for everyone.
The next month, revenue is down. Nobody can work out why, because the conversion rate is still up.
One number that sees both halves
Here is what happened, in arithmetic. Send 1,000 visitors to each version.
Version A: 3.0 percent buy. That is 30 orders at an average of $50. Revenue, $1,500.
Version B: 3.6 percent buy. That is 36 orders. But with the discount the average order is $38.
Revenue, $1,368.
Version B got six more orders and $132 less money. The test measured how many people bought and never asked how much they spent.
There is a number that would have caught it. Divide revenue by visits. Version A earns $1.50 for every person who arrives.
Version B earns $1.37.
That is earnings per session. It is also conversion rate times average order value, which is the same thing written differently. Some tools call it revenue per visitor.
The useful thing about it is that it has no blind side. Raise the conversion rate by cutting the price, and it shows the cut. Raise the order size by scaring off small buyers, and it shows the lost orders.
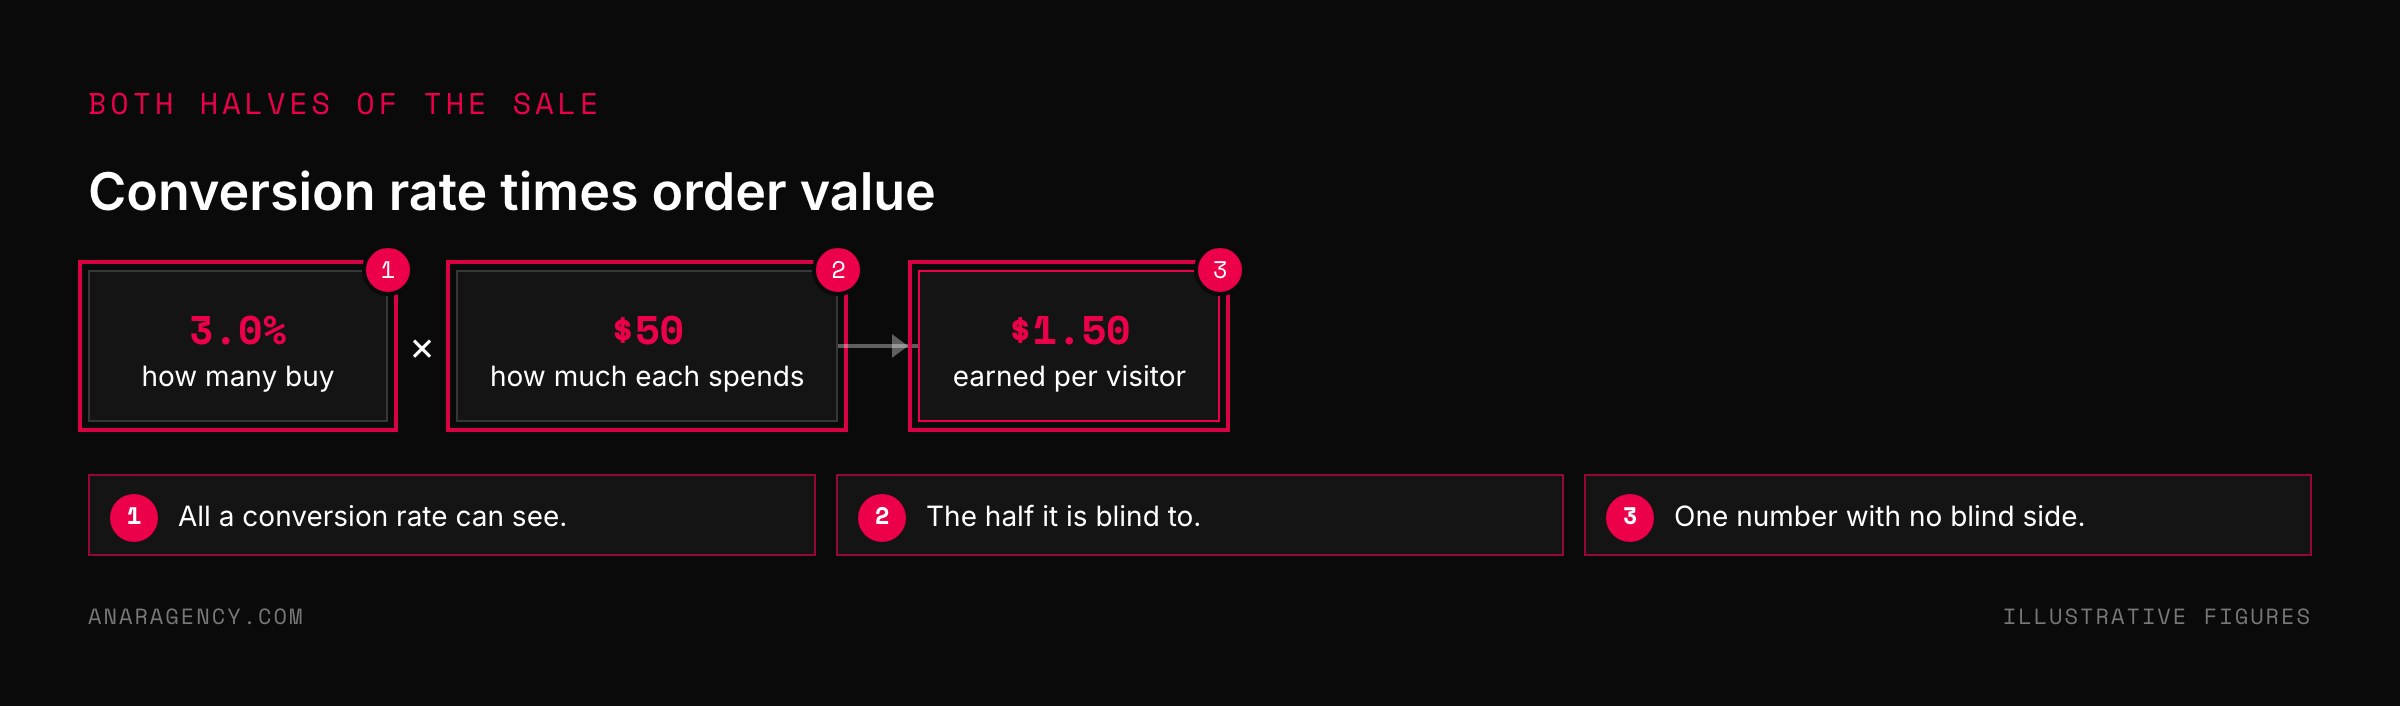
Judge every page and every test on earnings per session: revenue divided by visits, which equals conversion rate times average order value. Write it down as the judge before the test starts. Compare it with your cost per click, since a session must earn more than a click costs.
Fix the sample size in advance and do not stop early. For lead businesses, carry the calculation through to closed revenue, not form fills.
When a rate becomes the goal
The discount banner is a small version of an old and expensive mistake. You pick a rate to stand in for success, and then people chase the rate.
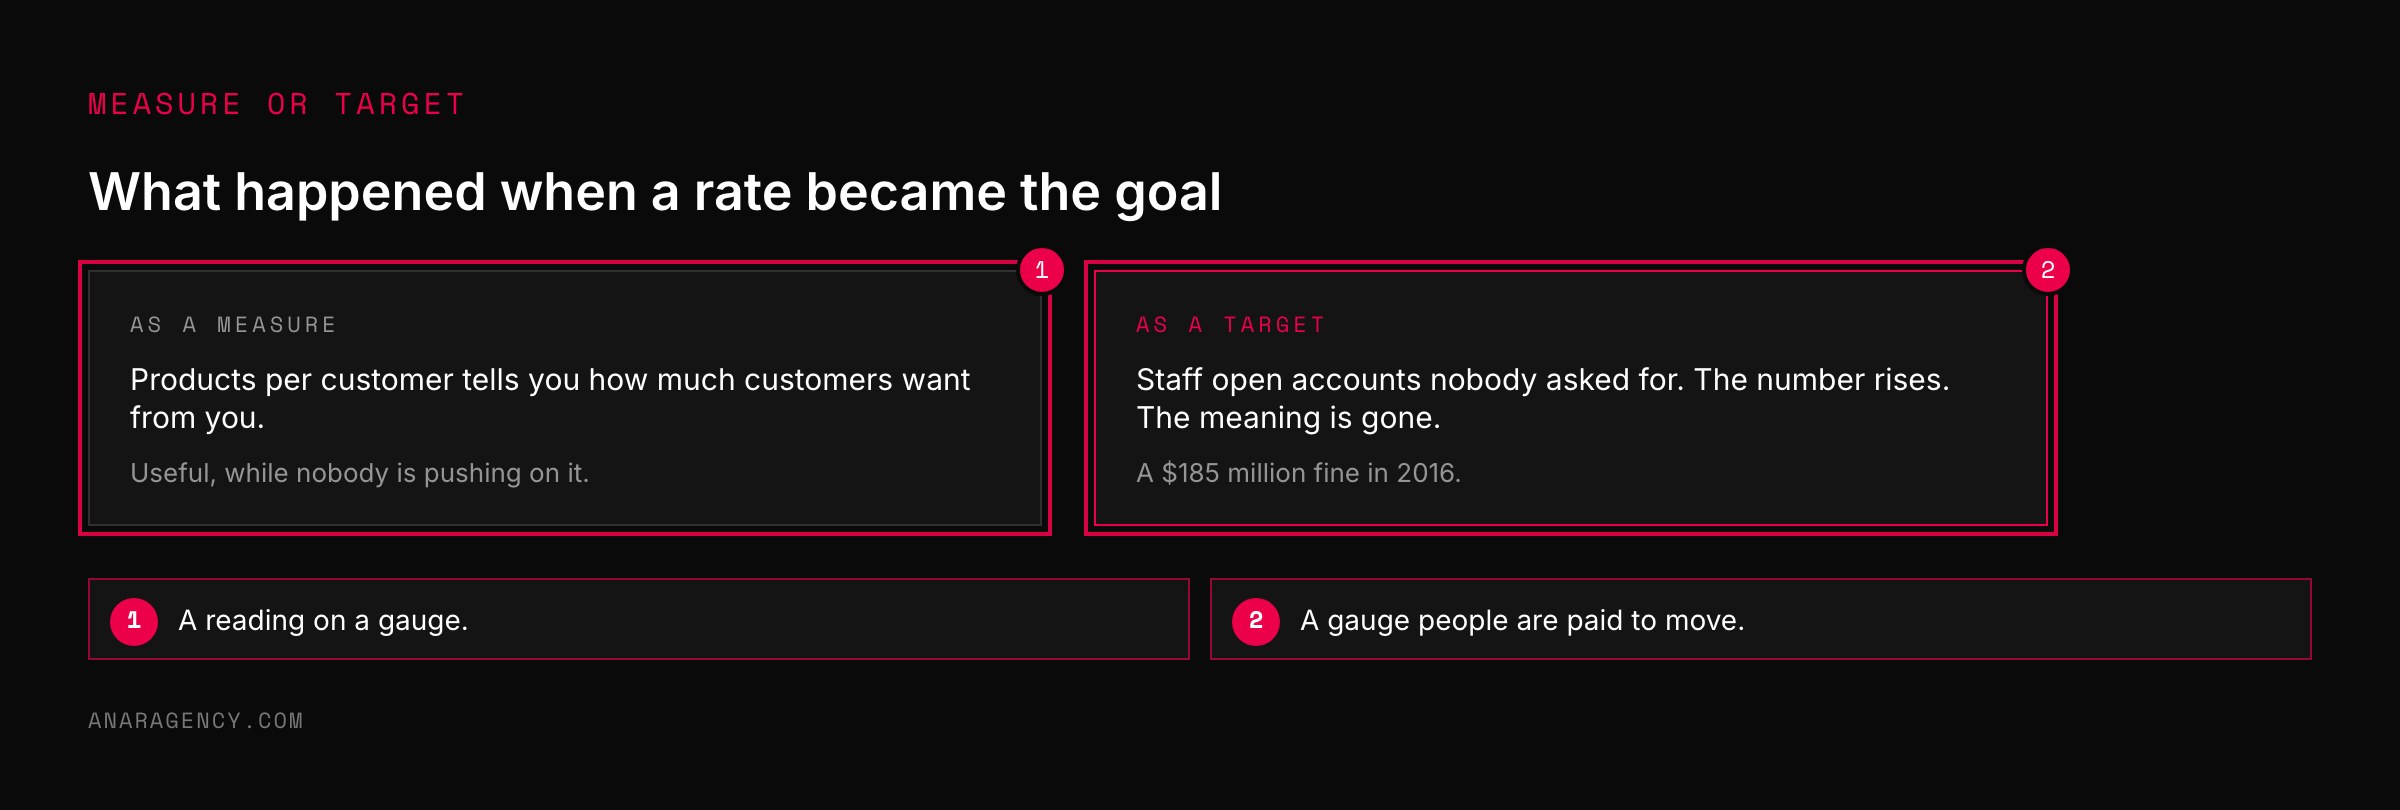
The largest recent example is a bank. For years Wells Fargo pushed its branches on one figure: the number of products each customer held. More accounts per customer was the sign of a healthy relationship.
Staff were given aggressive targets for it. What followed is well documented: employees opened millions of accounts that customers had never asked for, to hit the number.
The rate went up beautifully. The thing it was supposed to measure, customers who wanted more from the bank, did not. In 2016 the bank was fined $185 million, and far more followed.
Economists call the pattern Goodhart's law: when a measure becomes a target, it stops being a good measure.
Conversion rate is a fine measure. It is a dangerous target, because there are so many ways to raise it that make you poorer.
Money Counters: how careful testers work
Some teams run page tests for years and their revenue actually rises. They do three unglamorous things. We call them Money Counters.
They pick the judge before the test. Earnings per session, written down in advance. Not whichever number looks best afterward.
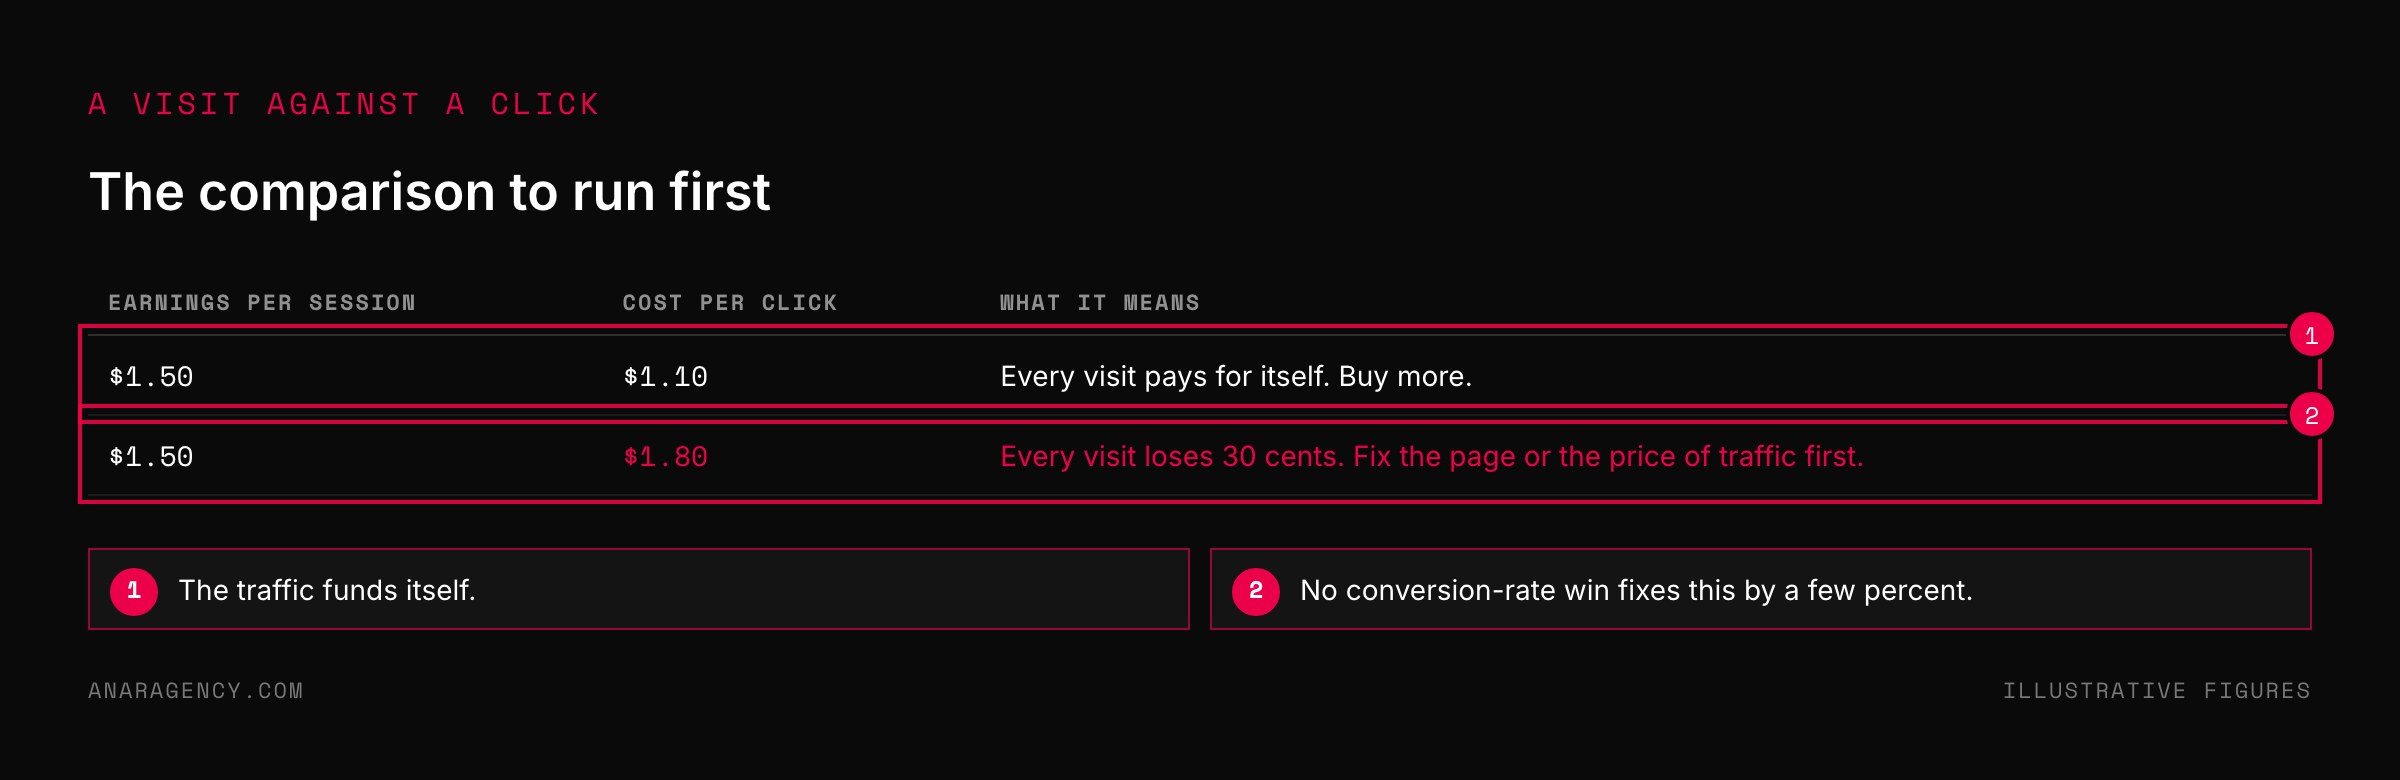
They compare it to the cost of a visit. If a session earns $1.50 and a click costs $1.10, the traffic pays for itself. If a click costs $1.80, a better conversion rate is not the problem to solve first.
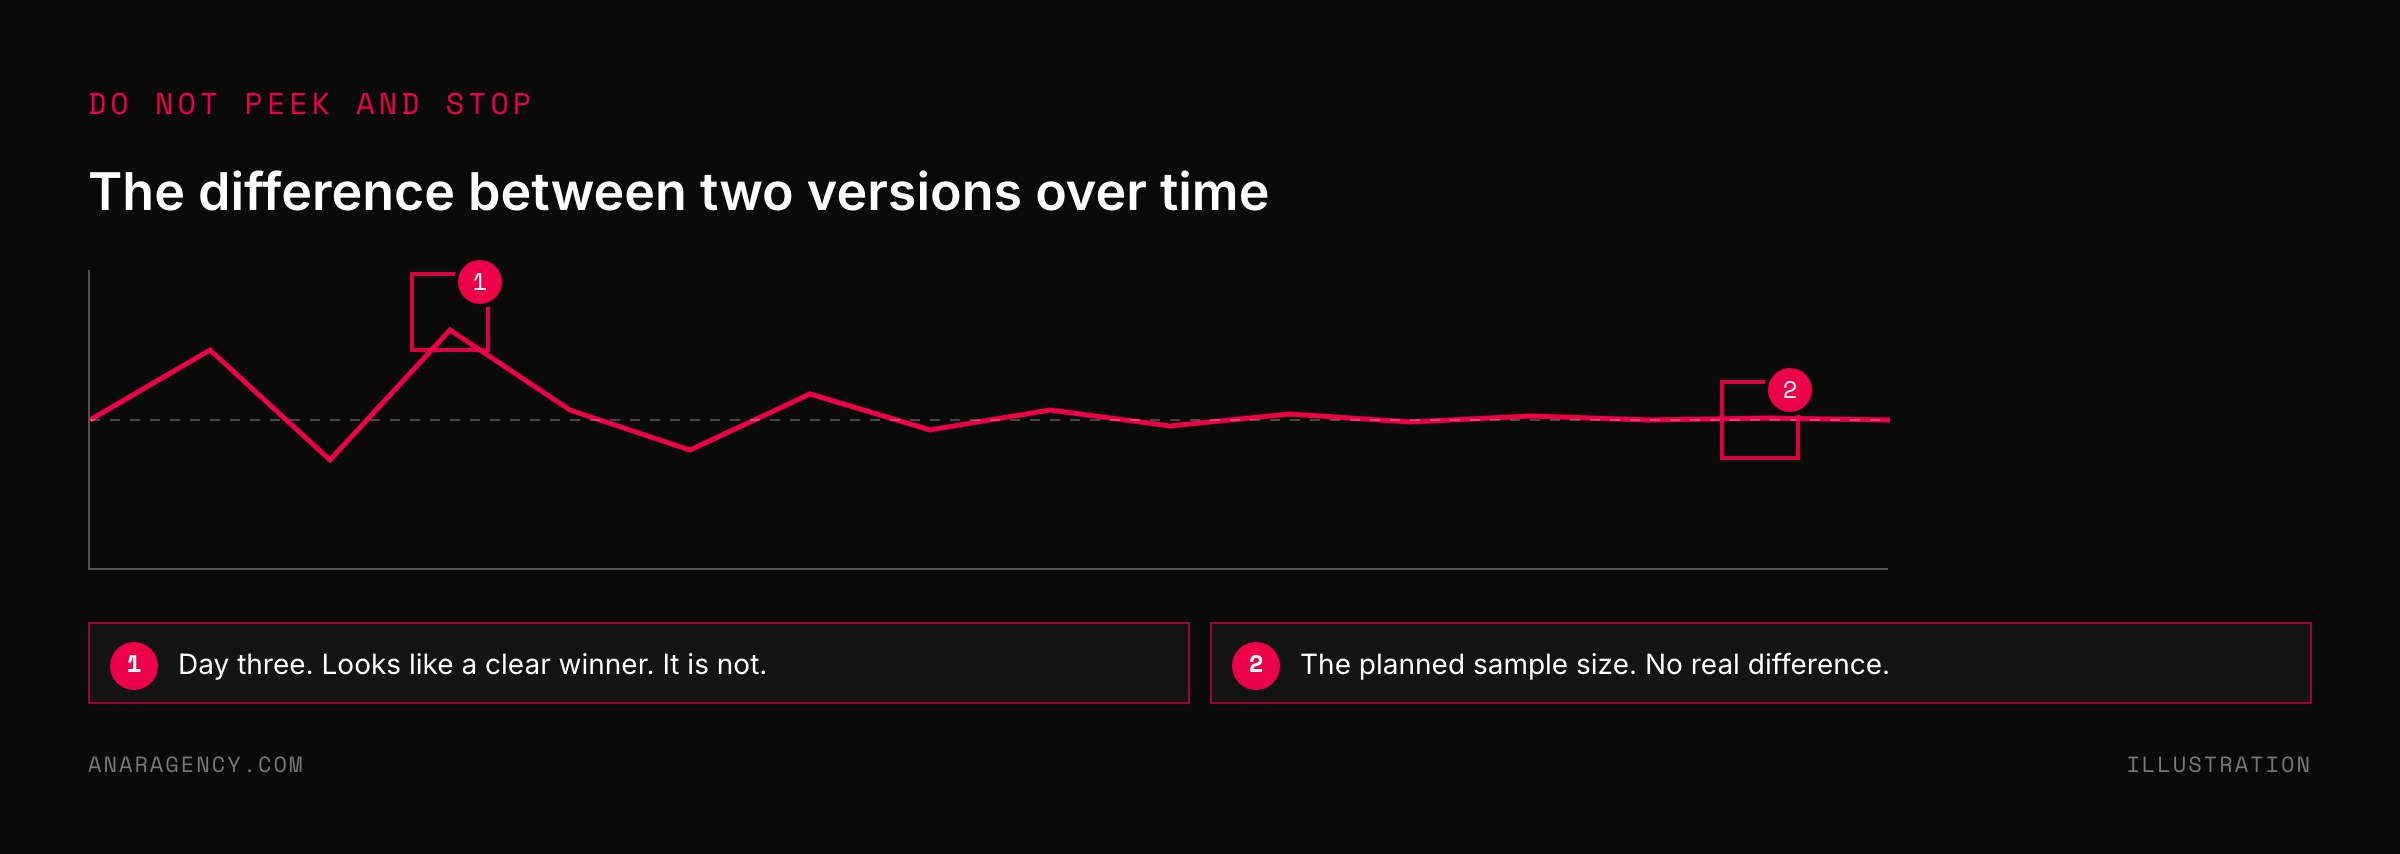
They do not peek and stop. This is the most common way a test lies. You check on day three, one version is ahead, and you call it.
The statistician Evan Miller explained the trap in a short essay that every tester should read. If you stop a test the moment it looks significant, you will declare winners that are nothing but noise. Decide the sample size first, and wait for it.
They also watch people, not just numbers. A recording tool like Microsoft Clarity shows why a version lost, which a spreadsheet never will.
"I sell one thing at one price."
You may be thinking this is for stores with carts and bundles, and you sell one service at one price. Then conversion rate and earnings per session move together, and you lose nothing by using the better one.
But look closer, because most one-price businesses are not really one-price.
A lead-generation business has no order value on the page. It has one later. If version B brings in more leads and they close at half the rate, the page test "won" and the business lost.
Earnings per session, carried through to closed revenue, sees that.
A service business has a first job and then repeat work. A page that attracts bargain hunters converts well and earns little over a year.
And at the checkout, small things move order size as much as conversion. Baymard's research finds that extra costs appearing late are the most-cited reason people abandon a purchase. Fixing that raises both halves at once.
For the walk from ad to sale, and which number sits at each step, see reading ad data. For working backward from a revenue goal, see book-a-call math.
What to read next, and why
How Not To Run an A/B Test (essay): The clearest explanation of why stopping a test early gives you false winners. Fifteen minutes.
Wells Fargo cross-selling scandal (encyclopedia entry): The full story of a company that hit its number and lost its reputation.
Goodhart's law (encyclopedia entry): One paragraph that explains half the bad decisions in marketing.
Statistical significance (encyclopedia entry): What the word in your testing tool actually means, and what it does not.
So the simple takeaway is this: do not ask which version converted better. Ask which version earned more per visitor. They are not always the same version.
Questions executives ask
What is earnings per session?
Revenue divided by the number of visits. It equals conversion rate multiplied by average order value, and some tools call it revenue per visitor or earnings per click. It measures how much money each arriving visitor produces.
Why is conversion rate a misleading metric?
It counts how many visitors bought and ignores how much they spent. A discount can raise conversion rate while lowering revenue per visitor. In an illustrative case, moving from 3.0 percent at a $50 order to 3.6 percent at a $38 order cuts revenue from $1,500 to $1,368 per 1,000 visitors.
How do I calculate earnings per session?
Divide total revenue from a page or campaign by the number of sessions it received in the same period. For example, $1,500 in revenue from 1,000 sessions is $1.50 per session. Compare that with your cost per click to see whether the traffic pays for itself.
When should I stop an A/B test?
When it reaches the sample size you chose before starting, not when one version first looks ahead. Checking repeatedly and stopping at the first significant result produces false winners, as statistician Evan Miller explains in his essay on the subject.
Does earnings per session work for lead generation?
Yes, if you carry it through to revenue. Count closed revenue from the leads a page produced, divided by its sessions. A page that produces more leads that close at a lower rate can look like a winner on form fills and a loser on revenue.

Filip Kovacevic is the founder of Anar Agency in Phoenix. He spent five years running SEO, Meta ads, email, and content for medical practices across the United States, and now does the same work for healthcare, home-service, legal, and professional-service businesses, alongside AI implementation. More from Filip →
Talk it through in 15 minutes
Bring one AI question from this article. We will tell you what we would do, whether or not you hire us.
Book a 15-Min Chat →